Dash0 single-card usage pricing
Dark single-panel usage pricing listing per-million rates and retention per data type with one full-width CTA.
Summary
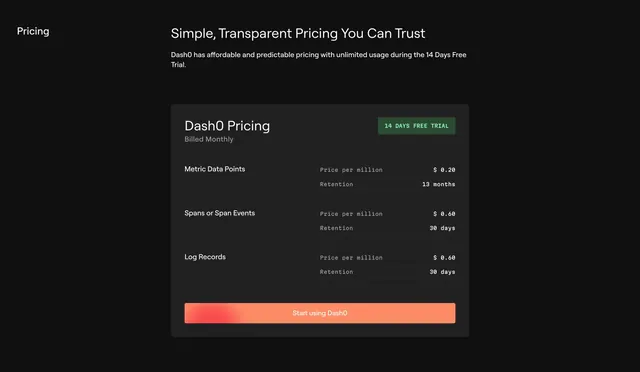
A dark pricing section that rejects tiers in favor of one usage-based card listing a per-million price and retention period for each data type. The single transparent rate card is the defining idea.
Visual description
A small left-aligned "Pricing" label and an oversized headline "Simple, Transparent Pricing You Can Trust" with a short supporting line sit over a near-black background. Below, one dark rounded card titled "Dash0 Pricing / Billed Monthly" with a green "14 DAYS FREE TRIAL" badge in the corner. The card lists three usage rows (Metric Data Points, Spans or Span Events, Log Records), each with a monospaced "Price per million" figure and a "Retention" value, separated by faint dividers. A full-width coral gradient "Start using Dash0" button spans the bottom of the card. Numbers and rate labels are set in monospace for a precise, technical feel.
Key takeaway
Replacing a tier grid with a single honest usage-rate card when pricing is purely consumption-based, which feels transparent and removes plan-comparison friction. Setting all the figures in monospace reinforces the technical, no-tricks positioning, and the lone gradient CTA keeps the next step obvious.
Reuse notes
Best for usage-metered developer or data products where customers pay by volume rather than seats or tiers. Only works when pricing genuinely reduces to a few clear rates; complex plans would break the single-card clarity. Suits dark, technical brands and pairs naturally with a usage calculator if added later.
More like this
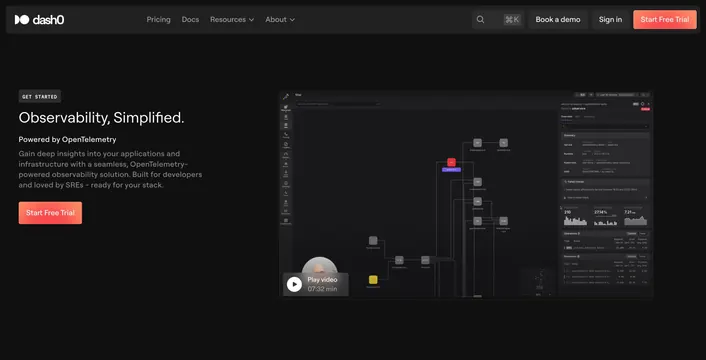 Dash0 dark hero with service-map preview
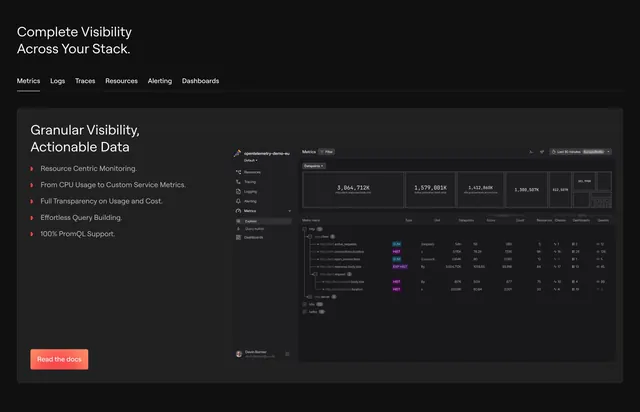 Dash0 split features with metrics explorer
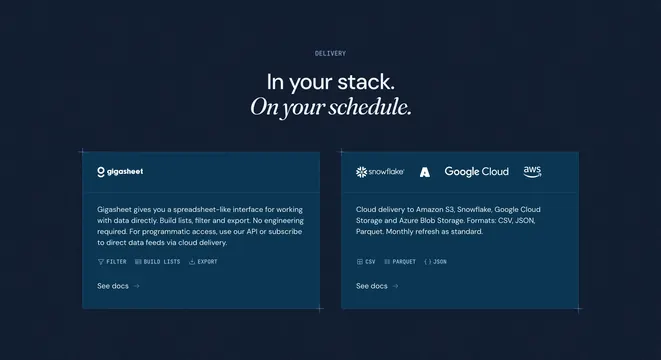 RevenueBase data delivery integration options
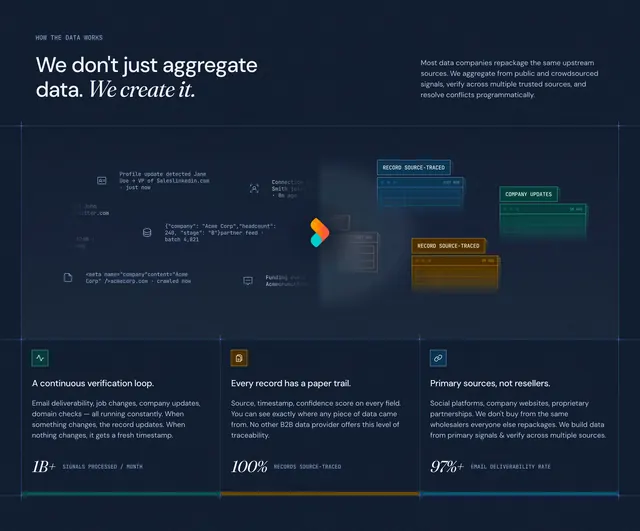 RevenueBase how-the-data-works value section
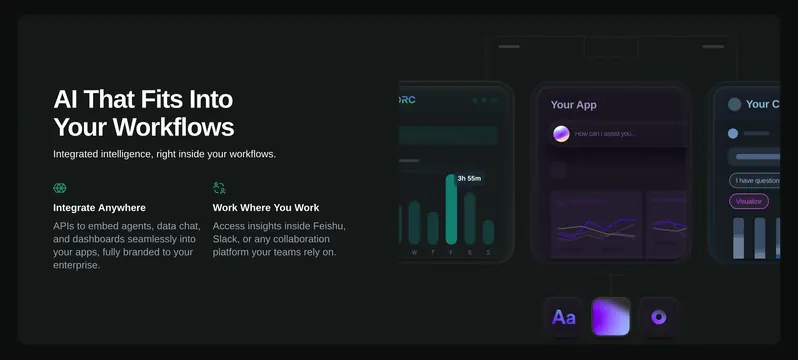 ReOrc AI workflow integration feature
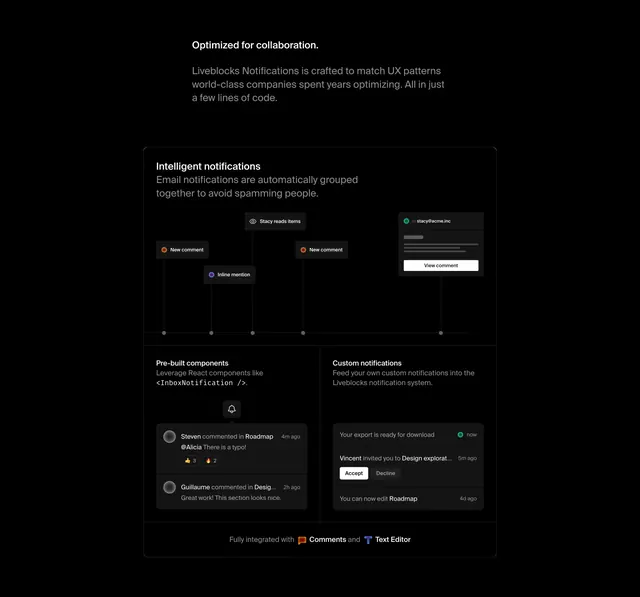 Liveblocks Notifications collaboration features
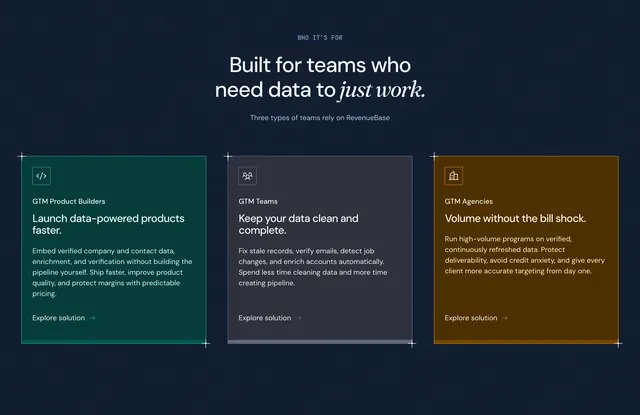 RevenueBase target users audience segmentation
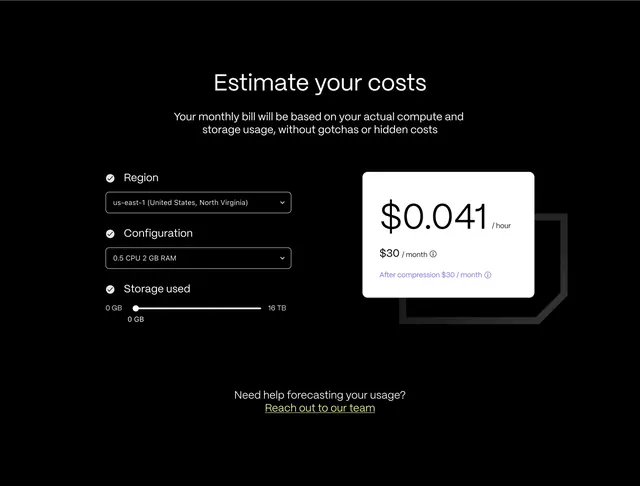 Timescale cost estimator with white result card
 RevenueBase dark footer sitemap
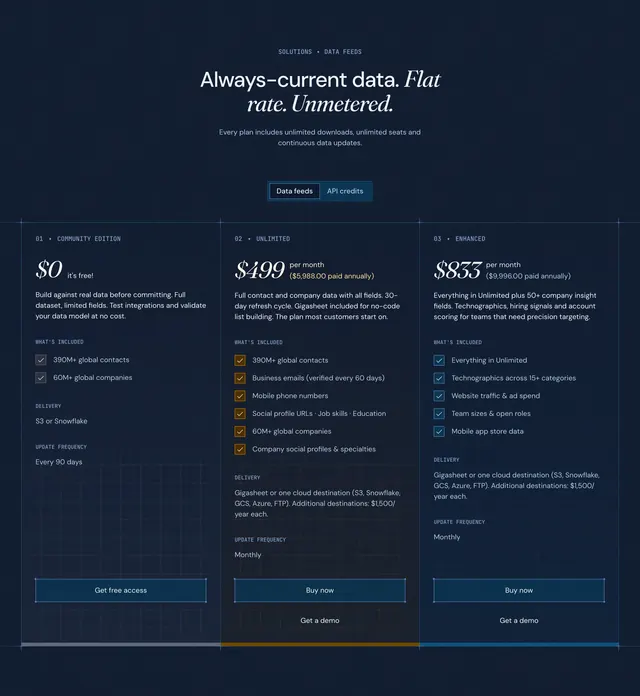 RevenueBase pricing tiers comparison table
 RevenueBase color-coded metrics grid
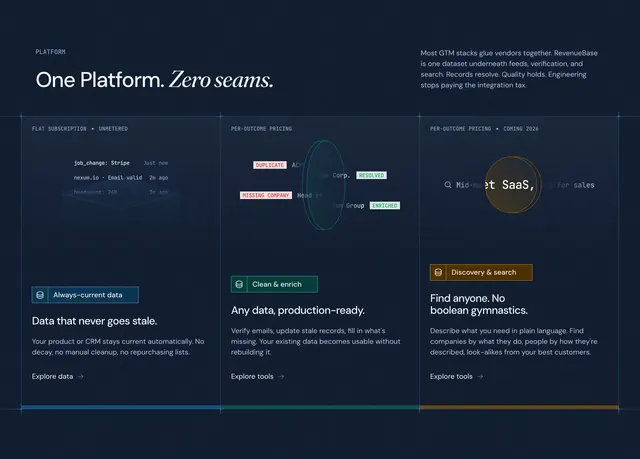 RevenueBase platform capabilities feature showcase
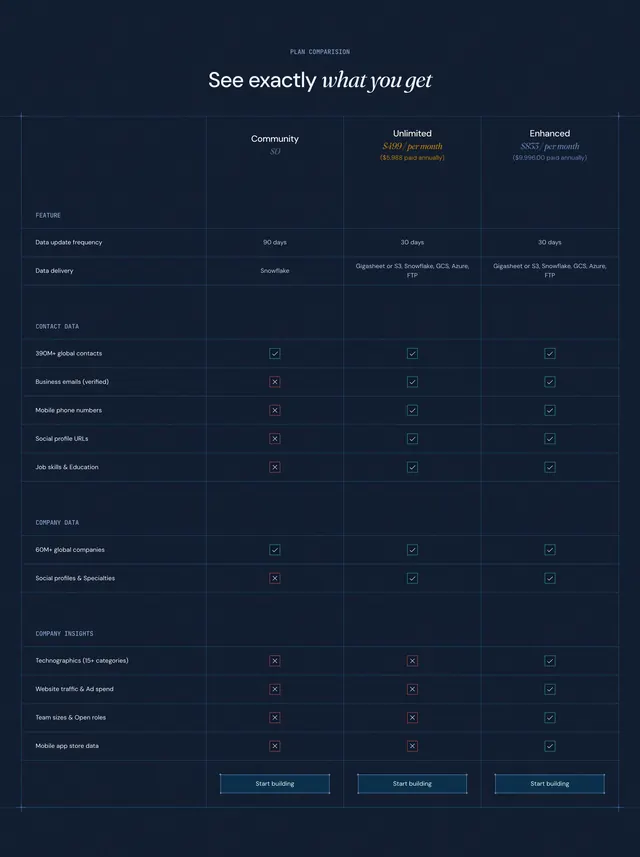 RevenueBase plan comparison feature table
 RevenueBase team directory grid
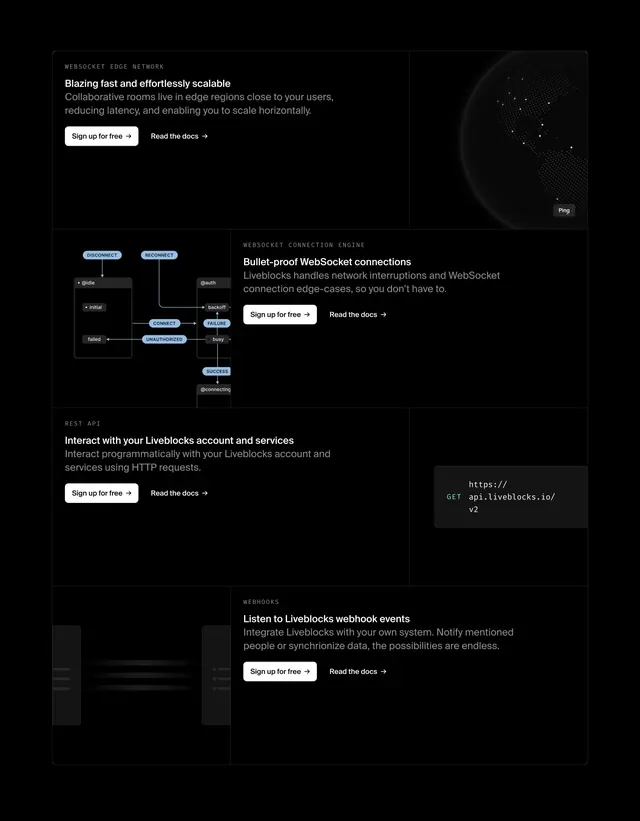 Liveblocks infrastructure feature grid
 Better Stack incident alerting CTA card
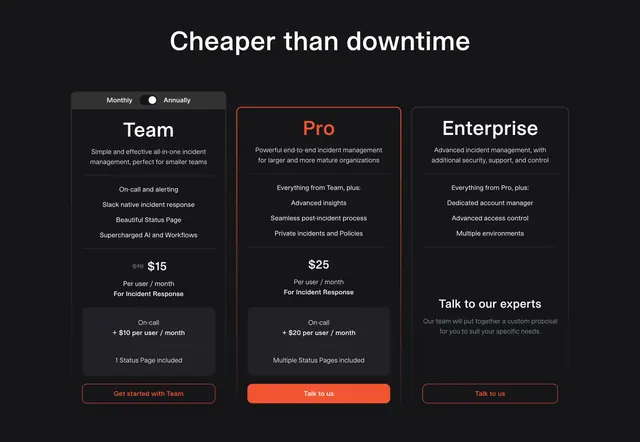 Incident.io dark three-column pricing with red accent
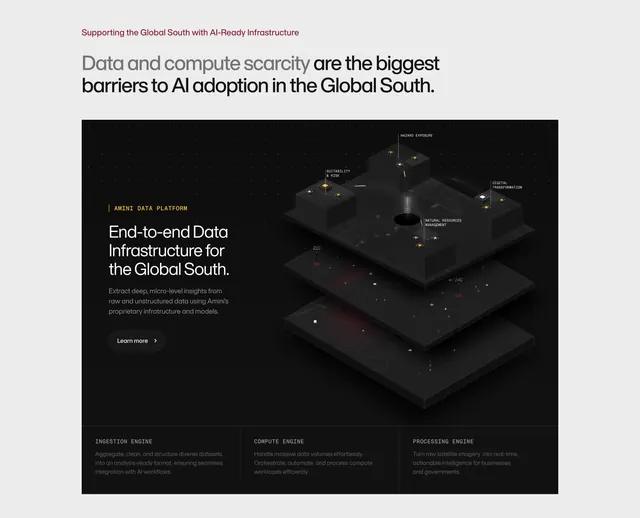 Amini dark contained feature panel with 3D isometric
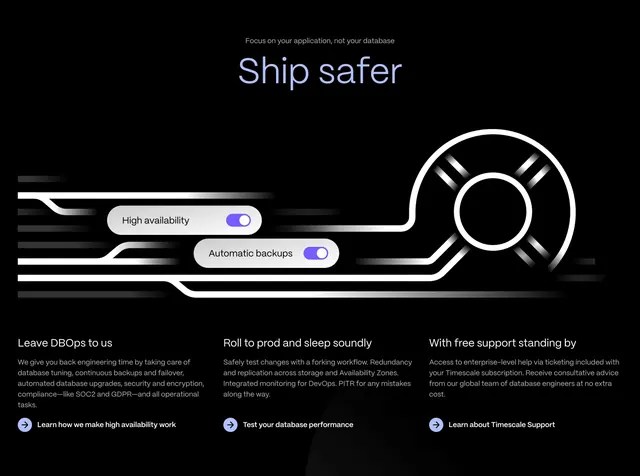 Timescale Ship safer benefits section
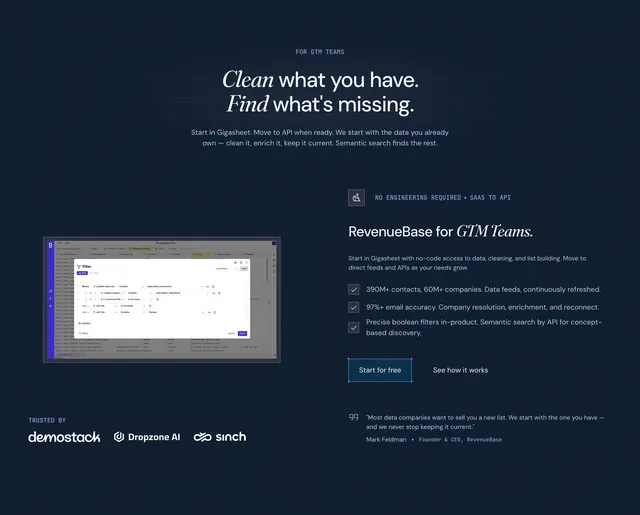 RevenueBase GTM teams value proposition
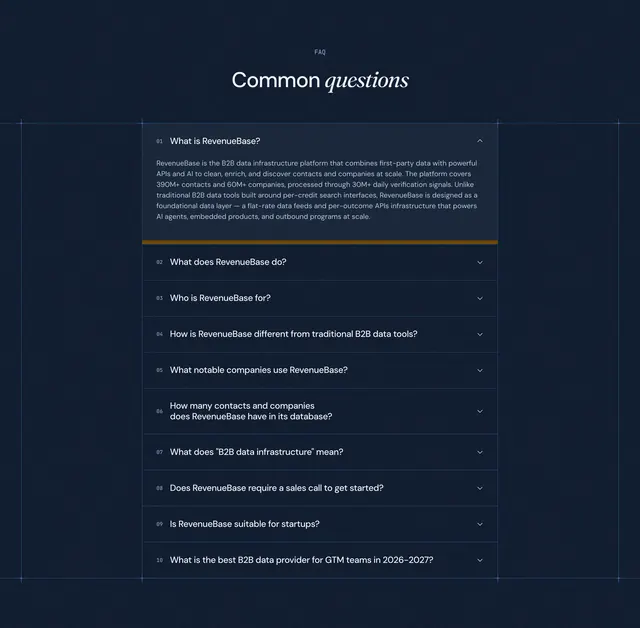 RevenueBase numbered FAQ accordion
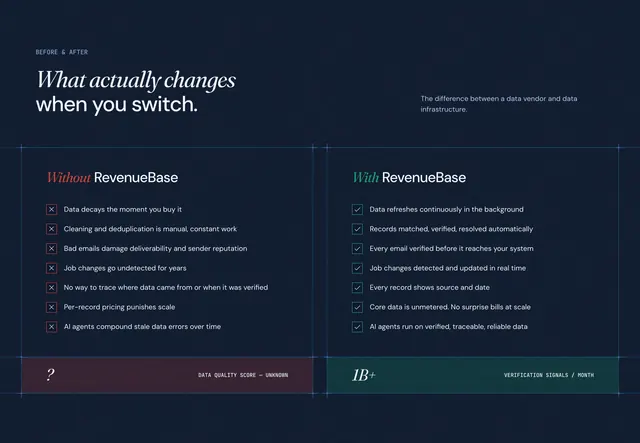 RevenueBase before-and-after comparison matrix
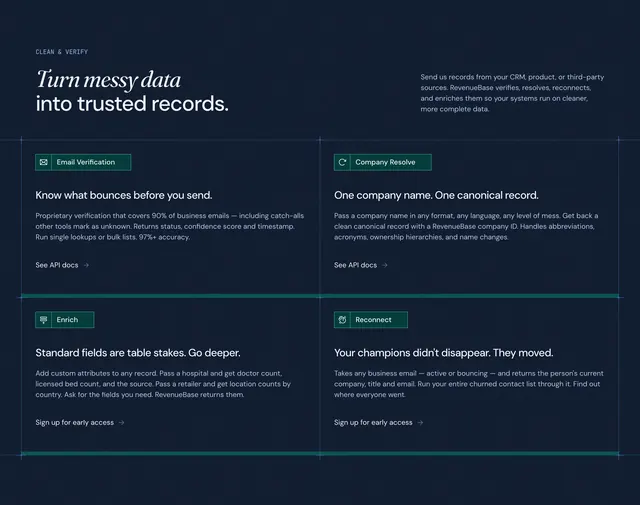 RevenueBase clean-and-verify feature grid
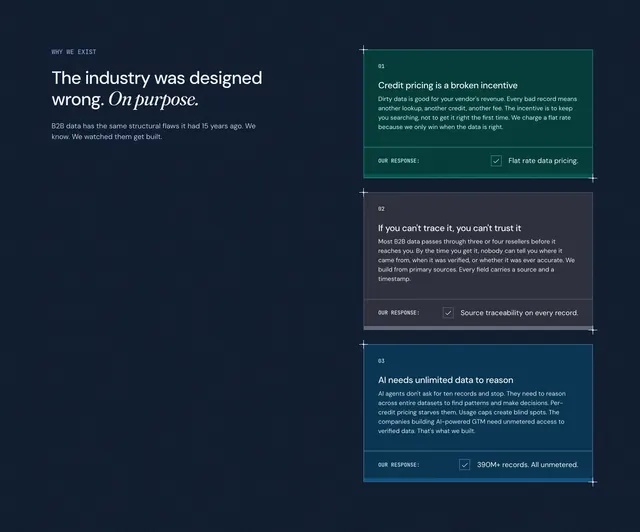 RevenueBase core problems issue-resolution cards