Statistics app mobile UI mockup
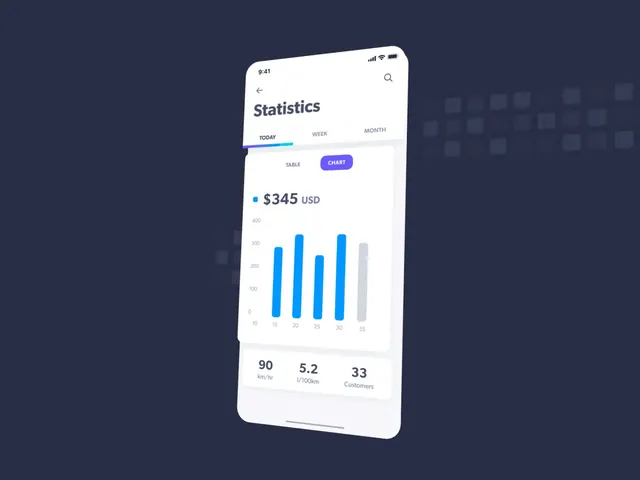
A smartphone mockup displaying a Statistics app with tabbed navigation, a blue bar chart, and key metric tiles on a dark navy background.
Summary
A white smartphone mockup against a dark navy background displaying a Statistics app with tabbed navigation and a prominent blue bar chart visualization.
Visual description
White iPhone mockup centered on a dark navy background. The app interface shows "Statistics" as the header with three tab options: TODAY (selected with a blue underline), WEEK, and MONTH. Below are toggle buttons for TABLE and CHART (CHART highlighted in bright blue). A blue bar chart occupies the central area, showing five bars of varying heights with x-axis labels from 10 to 35. The $345 USD figure is displayed prominently above the chart. At the bottom are three stat tiles: 90 km/hr, 5.2 l/100km, and 33 Customers. The mockup has rounded corners and realistic device proportions.
Key takeaway
Effective dashboard mockup design using clean typography, color-coded tabs and controls, and a clear visual hierarchy. The three stat tiles at the bottom demonstrate how to organize key metrics compactly. The bright blue accent color guides attention to interactive elements.
Reuse notes
Reference for analytics or productivity app designs. Works well for demos, pitch decks, or documentation. The mockup format is ideal for presentation contexts. Consider the color hierarchy between tab states and primary/secondary buttons when adapting. Note: this appears to be a UI mockup design rather than motion content.
More like this
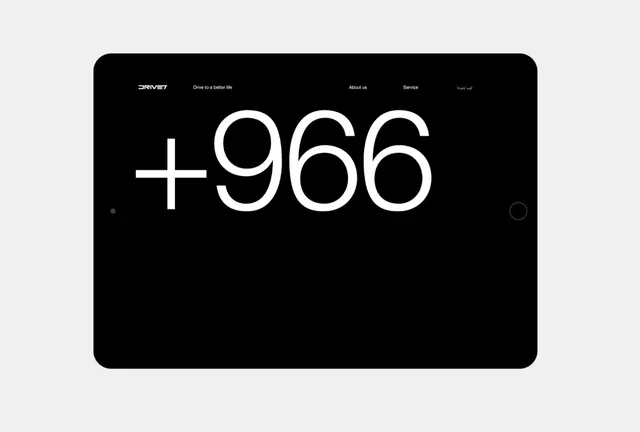 Minimalist interface counter with plus symbol
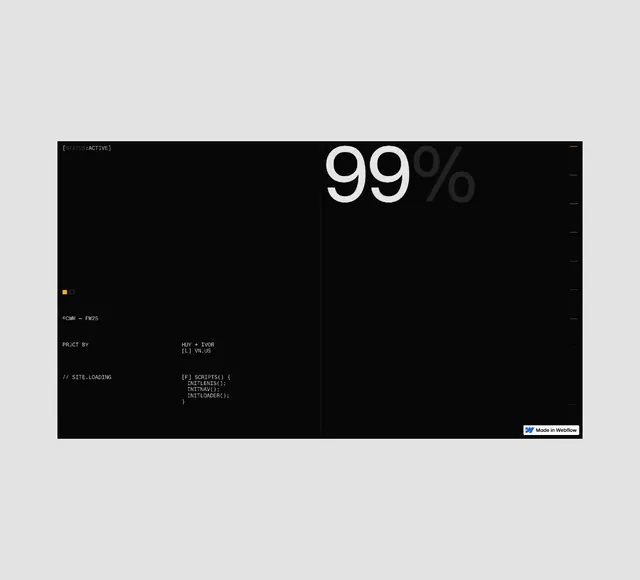 Minimalist Data Visualization Interface
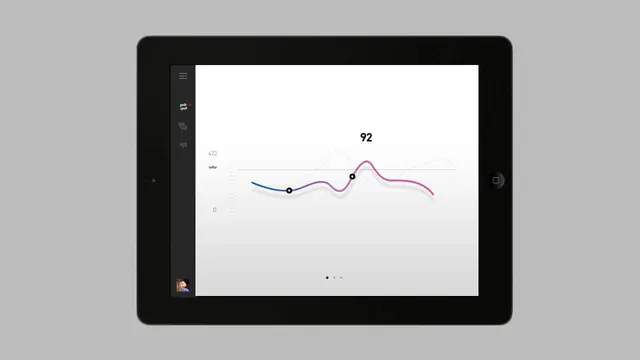 Tablet analytics dashboard interface
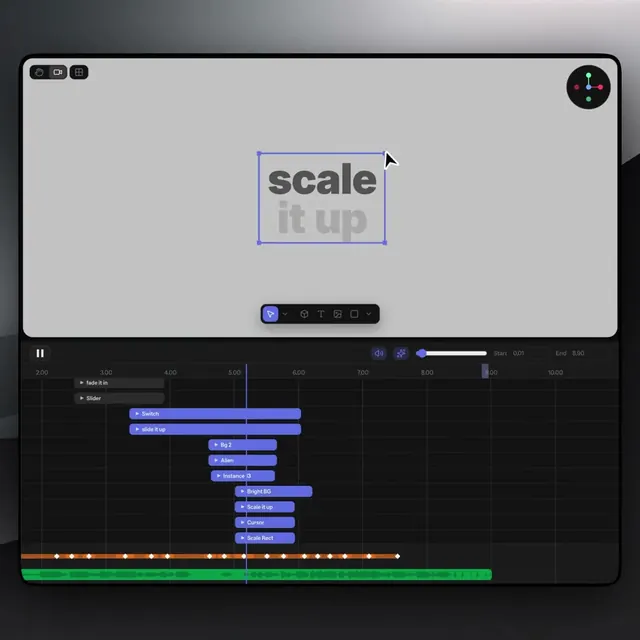 UI Design for Scale Up Tool
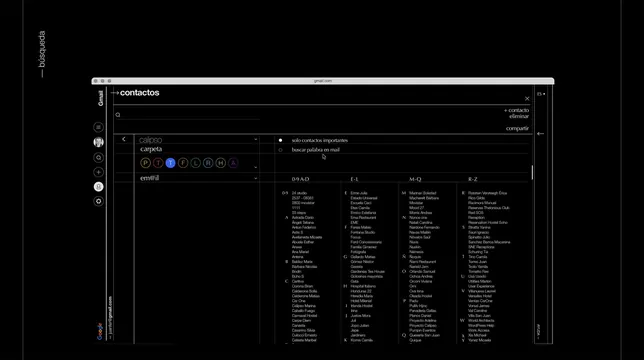 Dark Mode Dashboard Interface
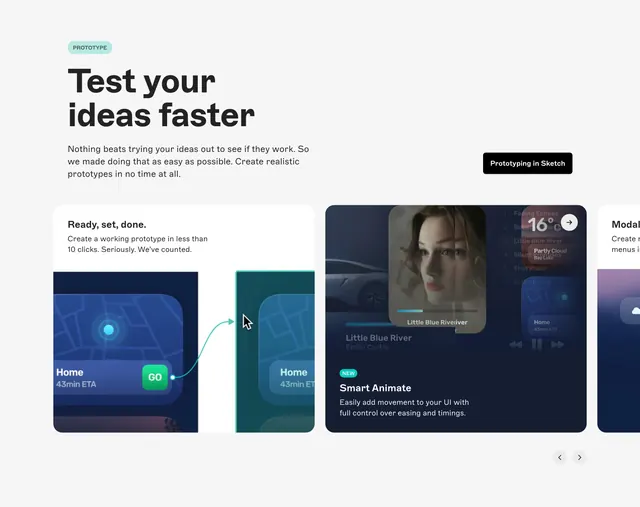 Sketch prototype feature carousel
 Satellite 3D Render
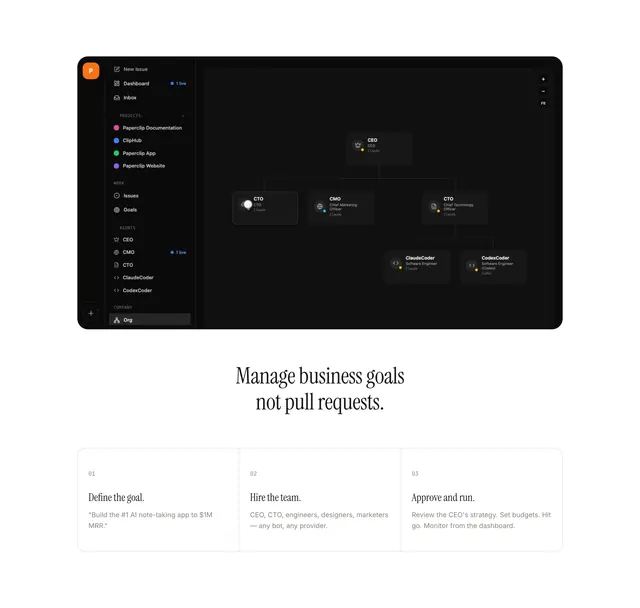 Paperclip workflow feature design
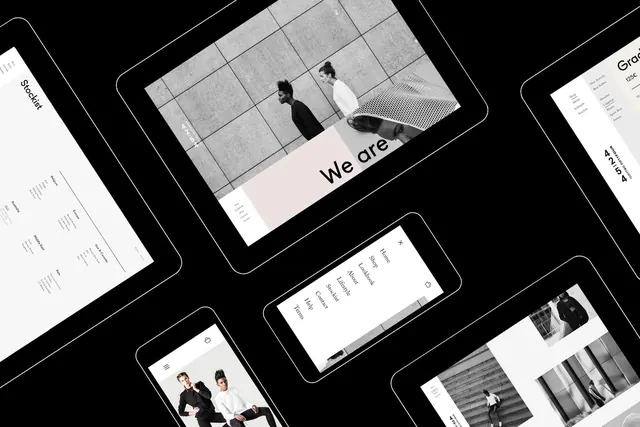 Modern UI/UX Design Mockup Collection
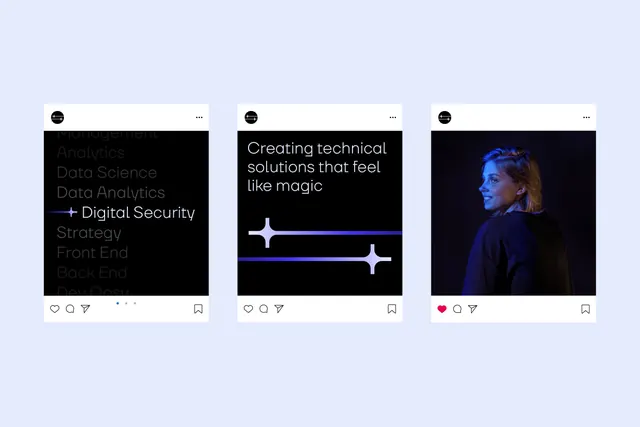 Dark SaaS UI mockup cards
 Abstract Geometric Typography Composition
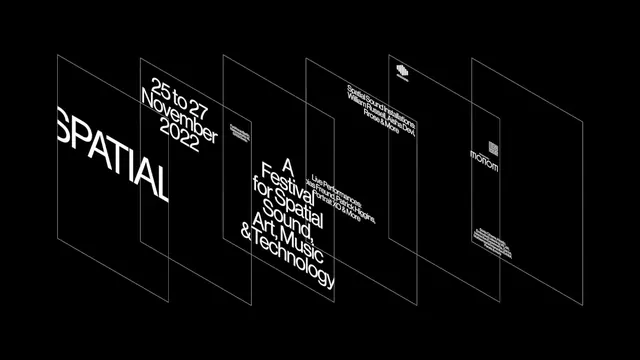 SPATIAL Identity System
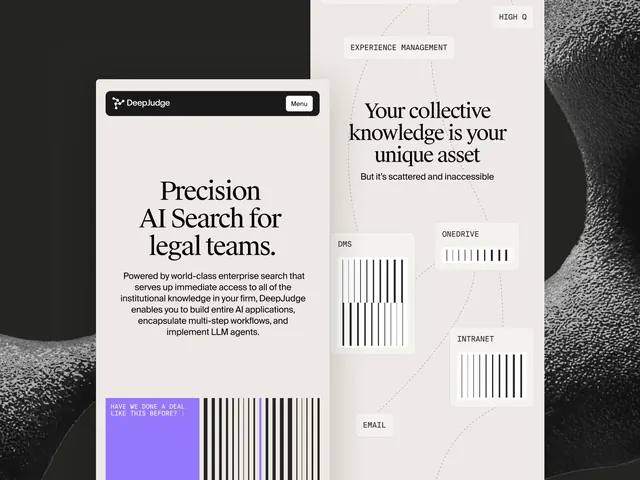 DeepJudge enterprise search interface mockup
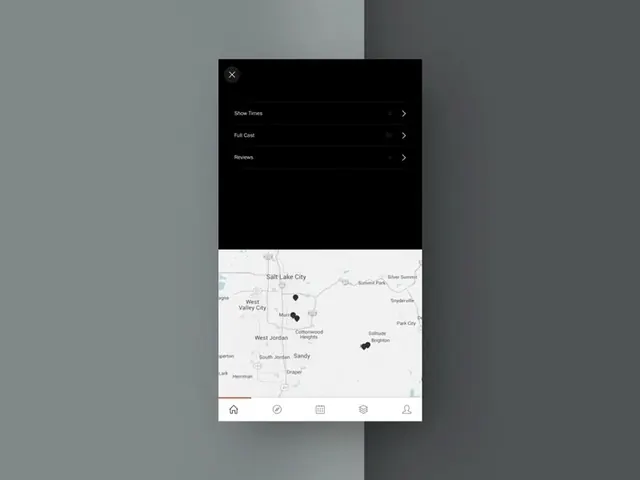 Mobile App UI Design Reference
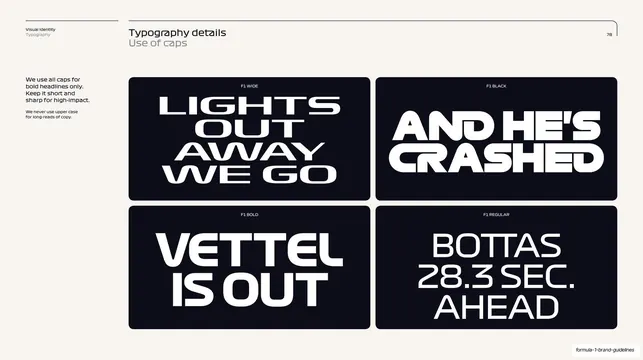 Use of caps, weight specimens
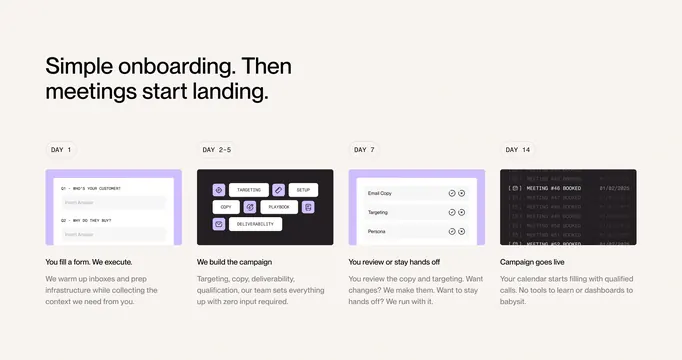 Throxy fourteen-day onboarding timeline
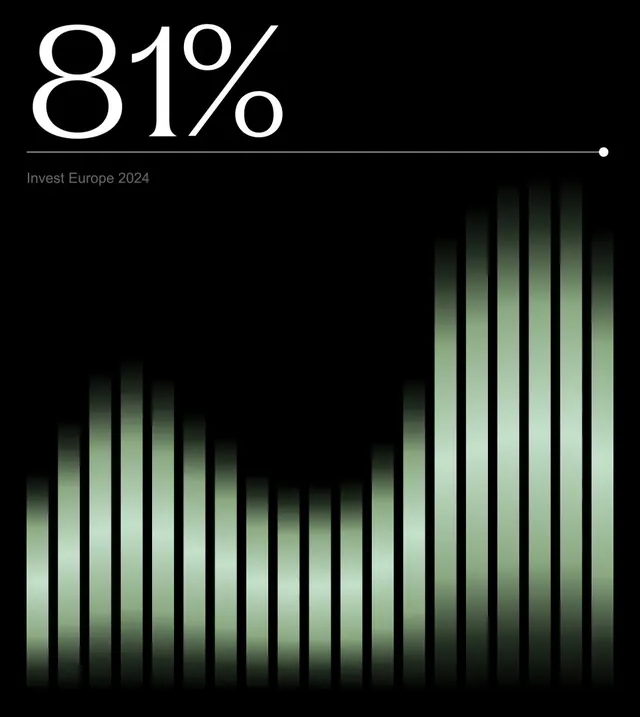 Invest Europe 2024 Data Visualization
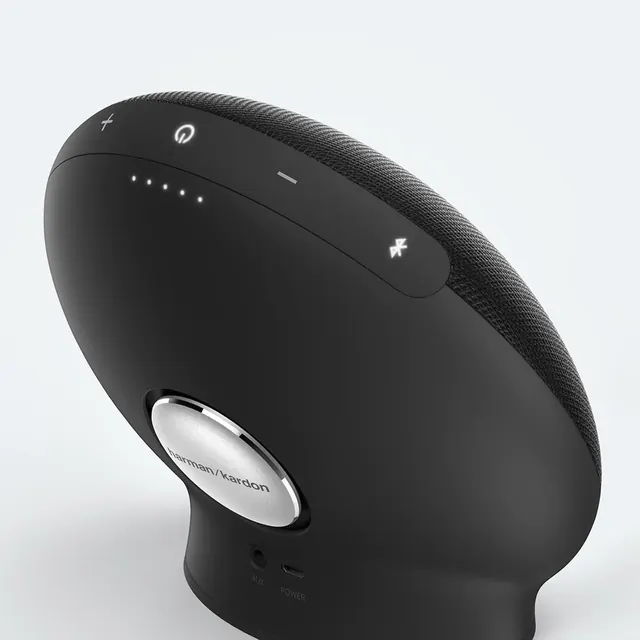 Harman/Kardon portable speaker product shot
 Nietzsche Pitch Deck 2023
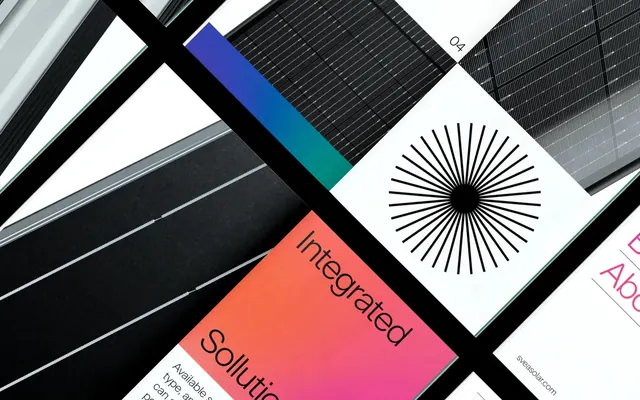 Integrated Solutions Identity System
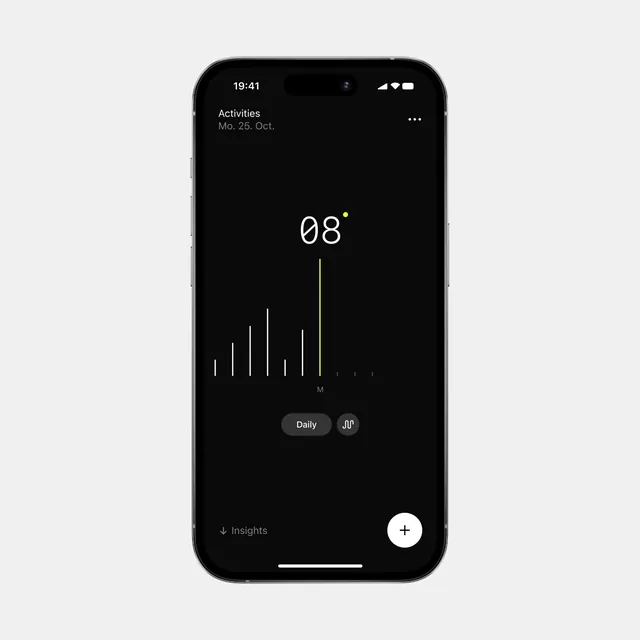 Dark Mode Analytics Dashboard
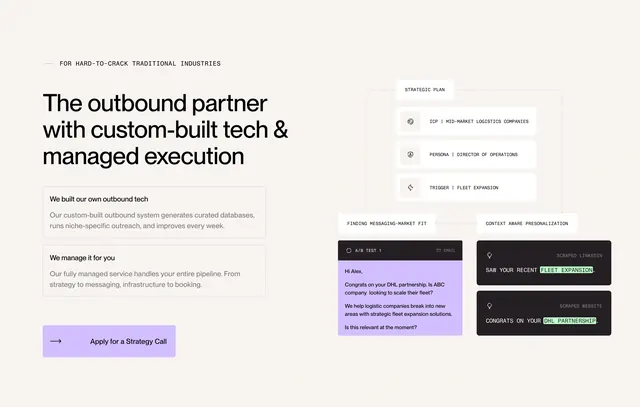 Throxy outbound partner feature diagram
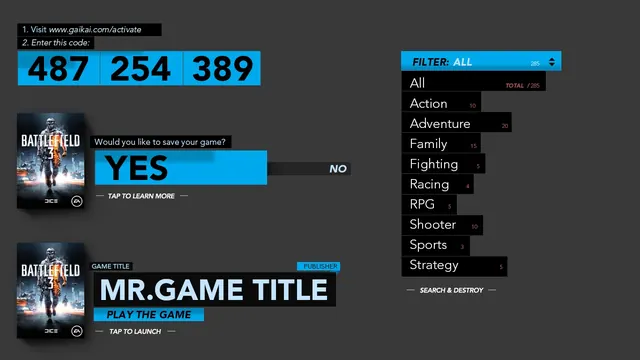 Typography and Layout Design Reference
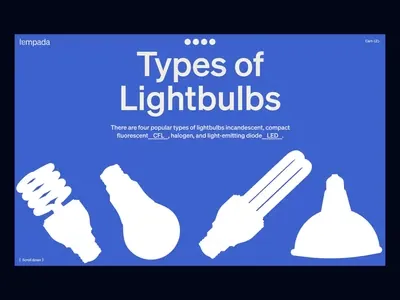 Types of Lightbulbs comparison infographic