Minimalist Data Visualization Interface
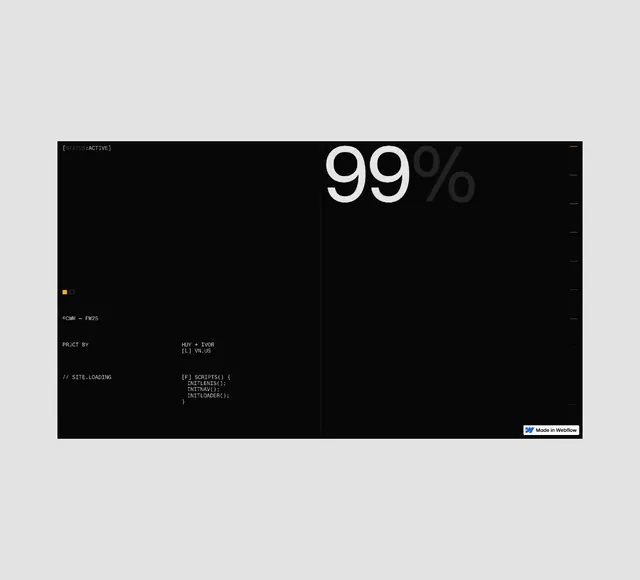
A dark-mode UI screen featuring a large percentage display and a structured data grid.
Summary
A dark-mode UI screen featuring a large percentage display and a structured data grid.
Visual description
The design features a large '99%' text in white against a black background, divided by a vertical line. A structured grid of small text and data points occupies the left side, while a 'loading' or 'progress' bar is visible at the bottom right.
Key takeaway
The layout demonstrates how high-contrast typography and a grid system can create a sophisticated, data-driven user experience.
Reuse notes
This layout can be adapted for financial dashboards, progress trackers, or technical performance monitors.
ColorDark, High Contrast, Monochrome
TypeSans Serif, Oversized, Condensed
MoodProfessional, Technical, Premium
IndustryAnalytics, Data, Developer Tool, Fintech, Saas
Tagsdashboard, percentage, grid, analytics, dark ui
Palette
#E6E6E6
#1F1F1F
More like this
 SPATIAL Identity System
 Data Dashboard UI Mockup
 Abstract Waveform Graphic
 Geometric Grid Logo
 Abstract Data Visualization Grid
 Concentric Dot Grid Sphere
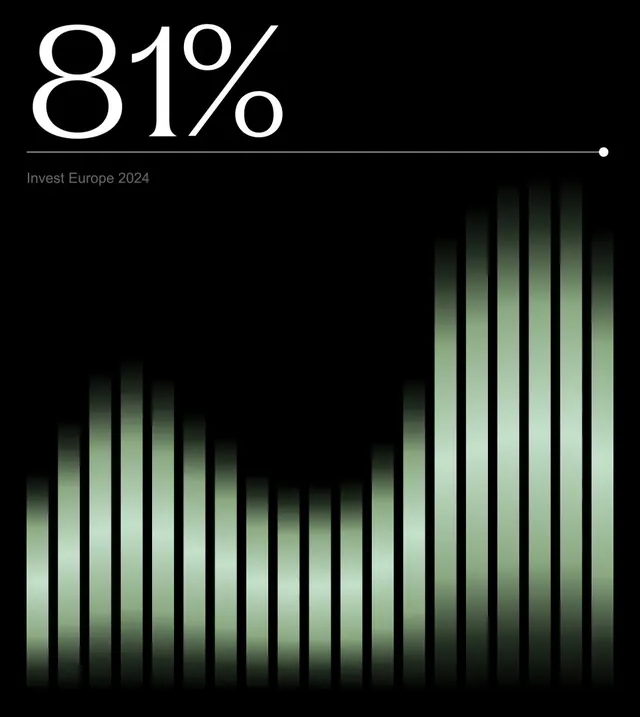 Invest Europe 2024 Data Visualization
 Typography and Symbolism Grid
 Typography and Grid Layout Study
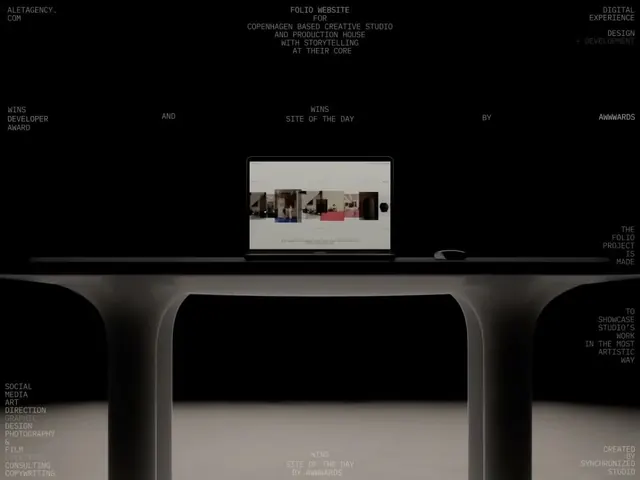 Dark Mode Dashboard Interface
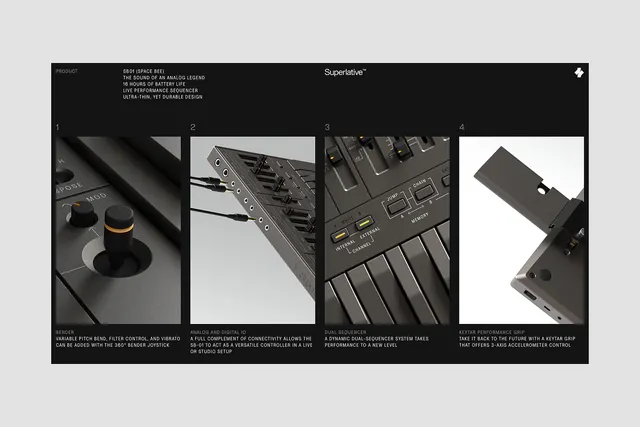 Technical UI and Hardware Mockup Showcase
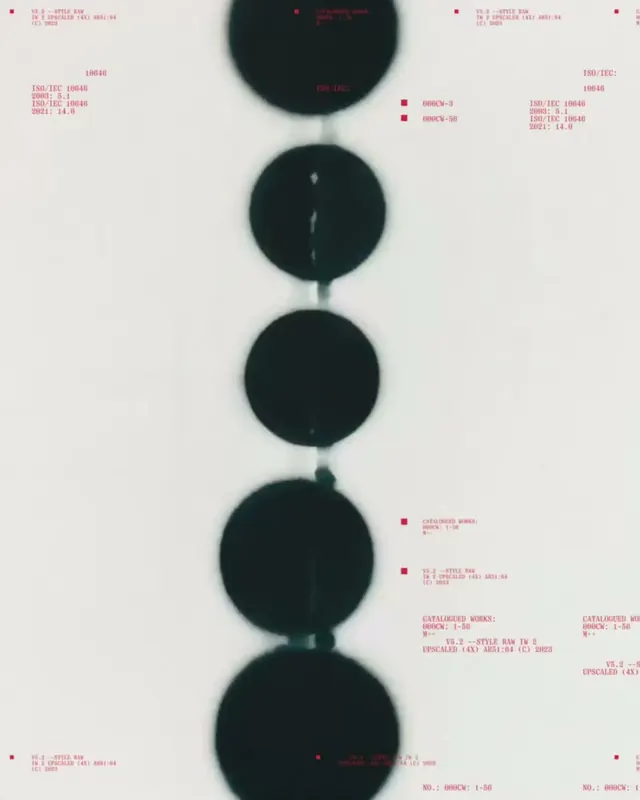 Abstract Geometric Data Visualization
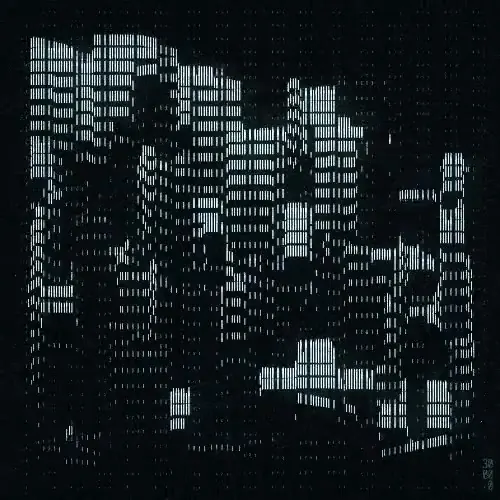 Abstract Data Visualization Grid
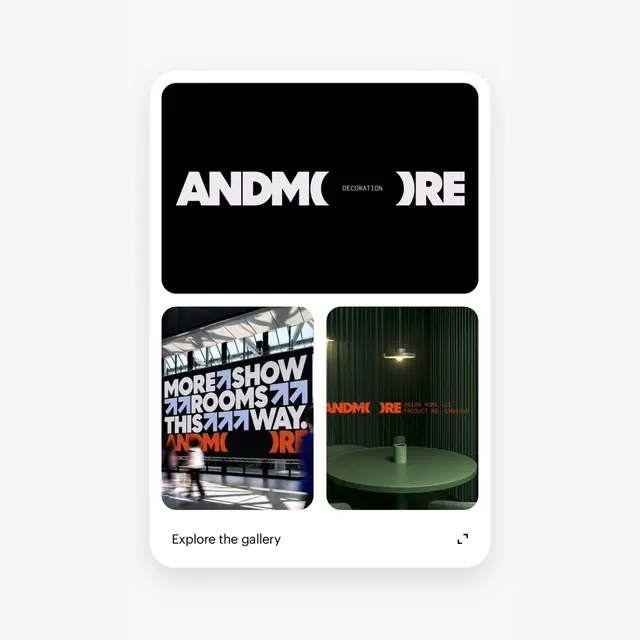 ANDMORE Identity System
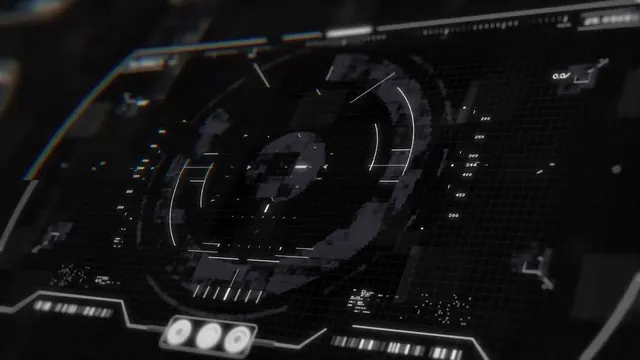 Technical Data Dashboard Interface
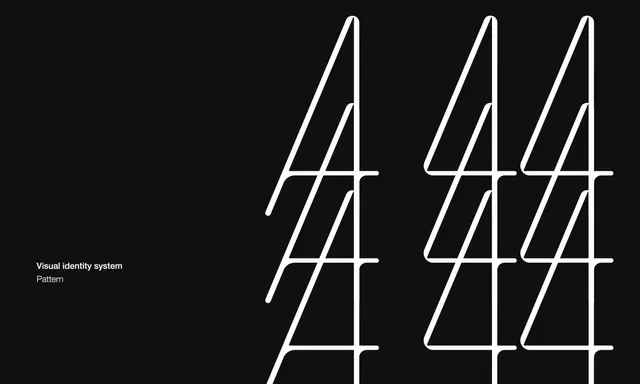 Visual Identity System - Pattern Study
 Abstract Geometric Typography Composition
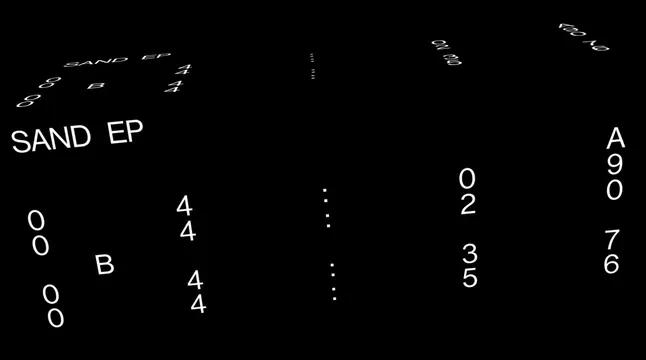 SAND EP Typography Layout
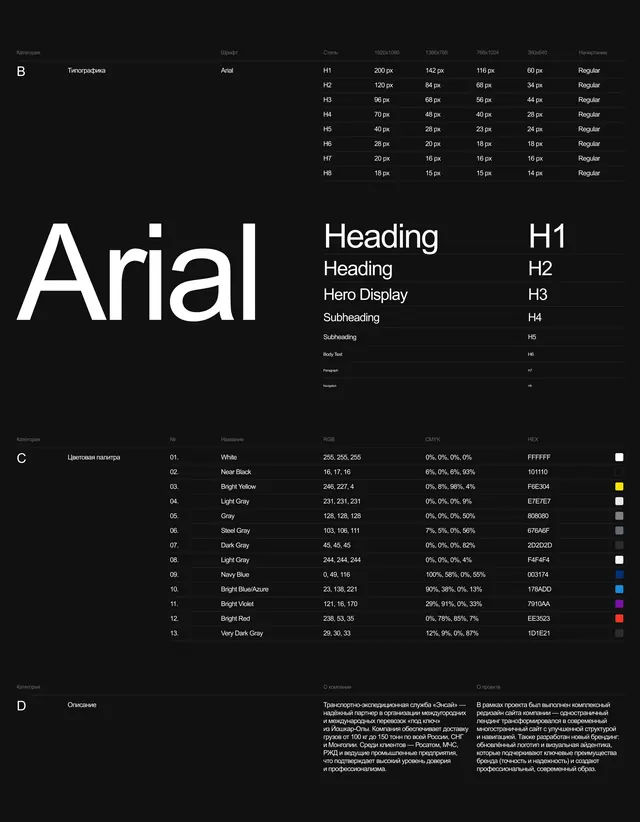 Arial Type Specimen and Data Visualization Layout
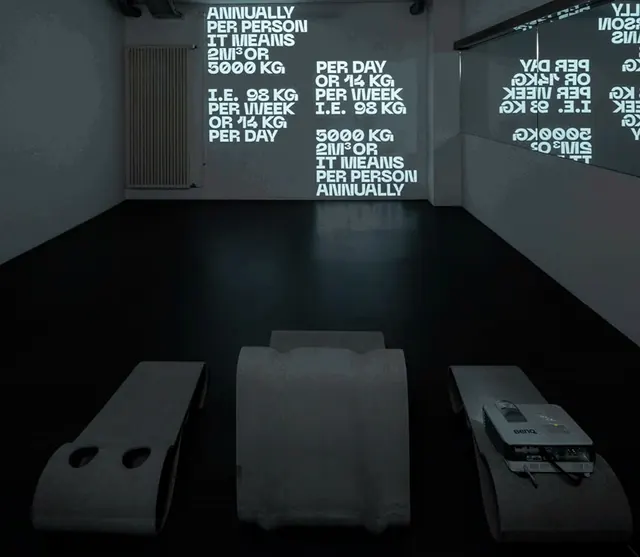 Typography-Driven Exhibition Mockup
 Technical Grid Overlay on Dark Texture
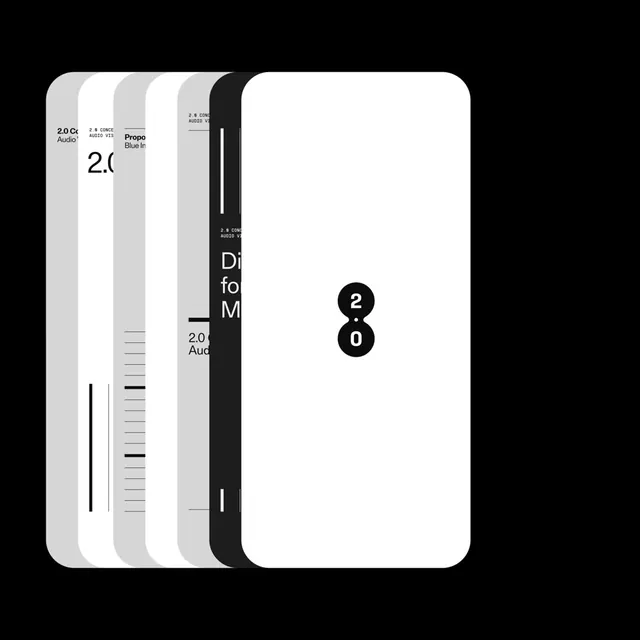 Minimalist Typography and Layout Study
 Dark Mode Mobile UI Mockup
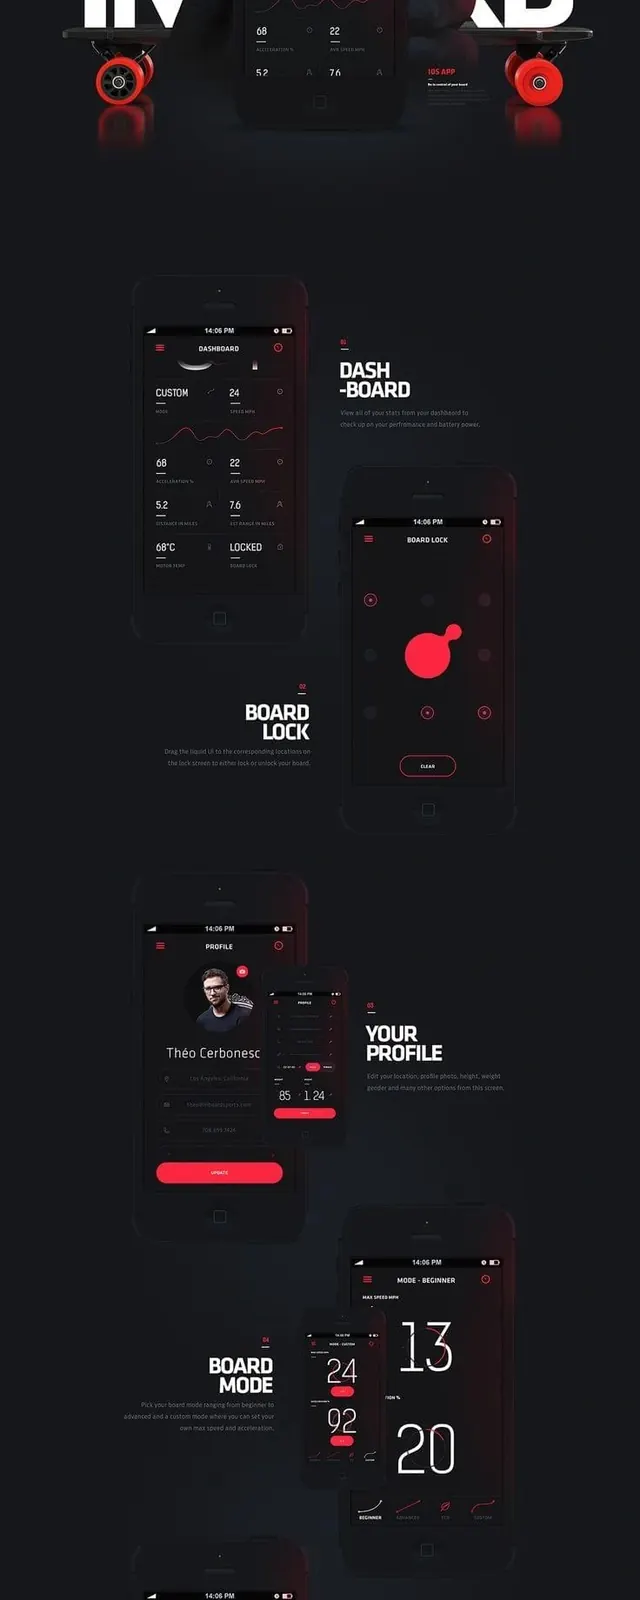 Dark Mode Data Visualization Dashboard