Data Visualization Dashboard
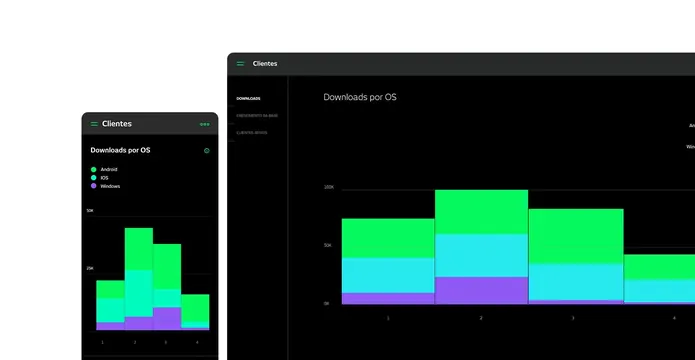
A dark-mode dashboard displaying a multi-colored bar chart representing downloads over time.
Summary
A dark-mode dashboard displaying a multi-colored bar chart representing downloads over time.
Visual description
A dark interface featuring a stacked bar chart with vibrant green, blue, and purple segments. The layout includes a sidebar navigation and a header with a title and date range.
Key takeaway
Uses high-contrast colors against a dark background to make data trends easily readable.
Reuse notes
Apply this high-contrast color palette and layout for other data-heavy analytics screens.
TypeSans Serif
MoodTechnical, Professional
IndustryAnalytics, Data, Developer Tool, Saas
Palette
#F7F7F7
#090A0A
#15ED9A
#915BF5
More like this
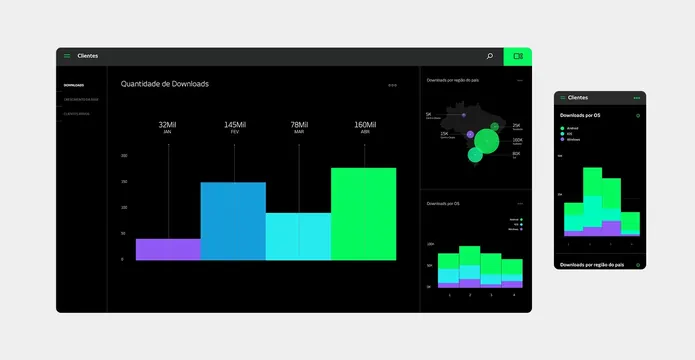 Data Visualization Dashboard
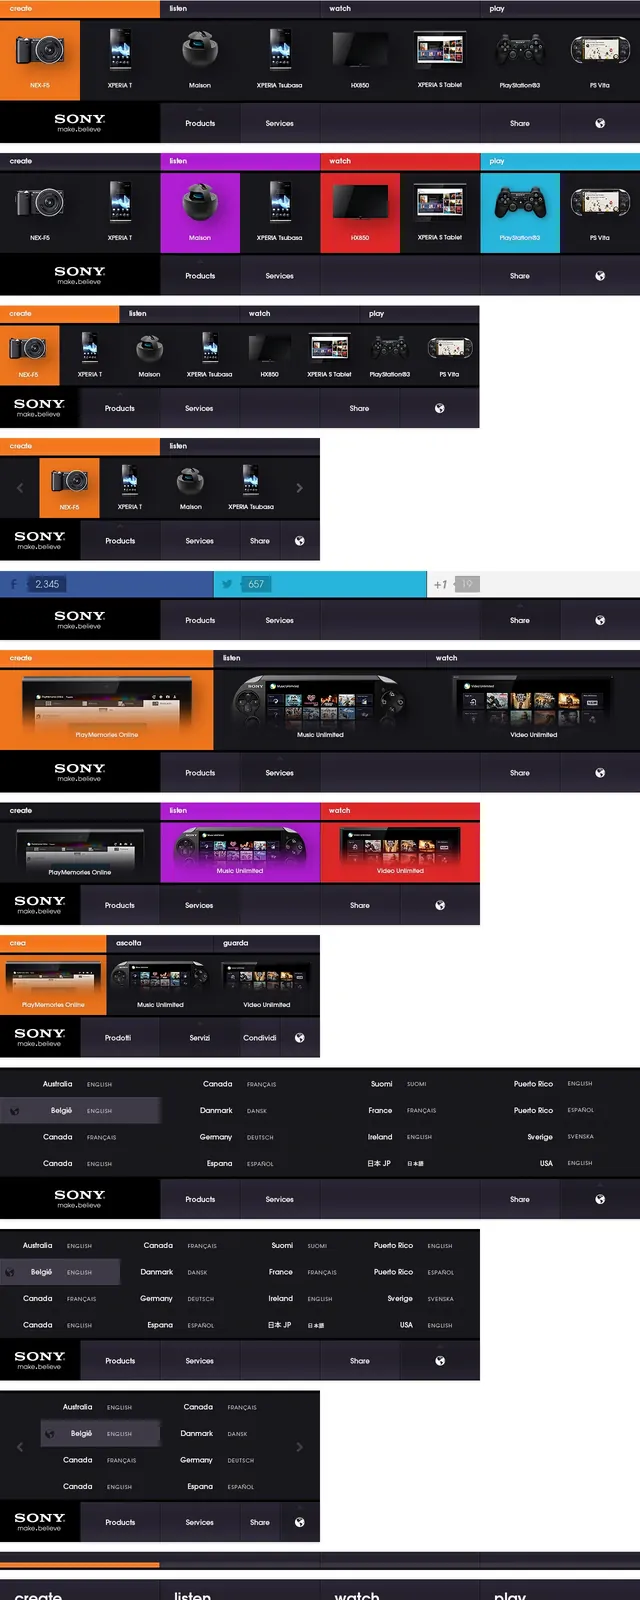 Dark Mode Dashboard UI Components
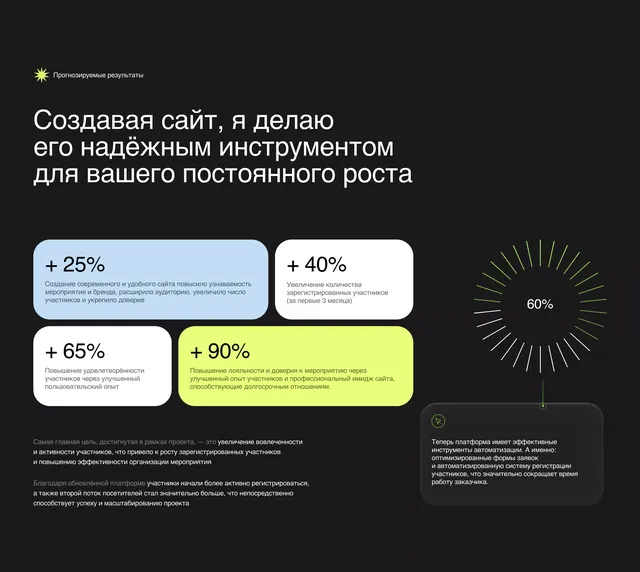 Dark dashboard with neon metric cards and circular gauge
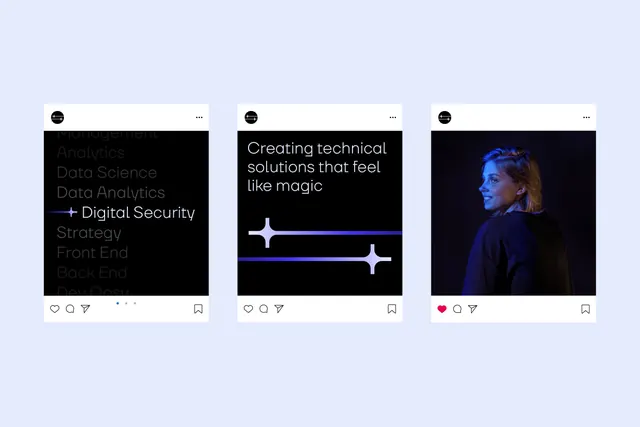 Dark SaaS UI mockup cards
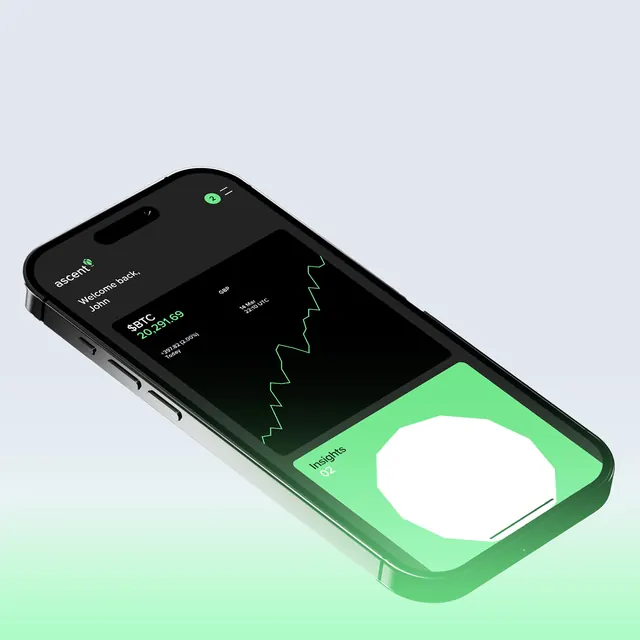 Smartphone UI Mockup with Gradient
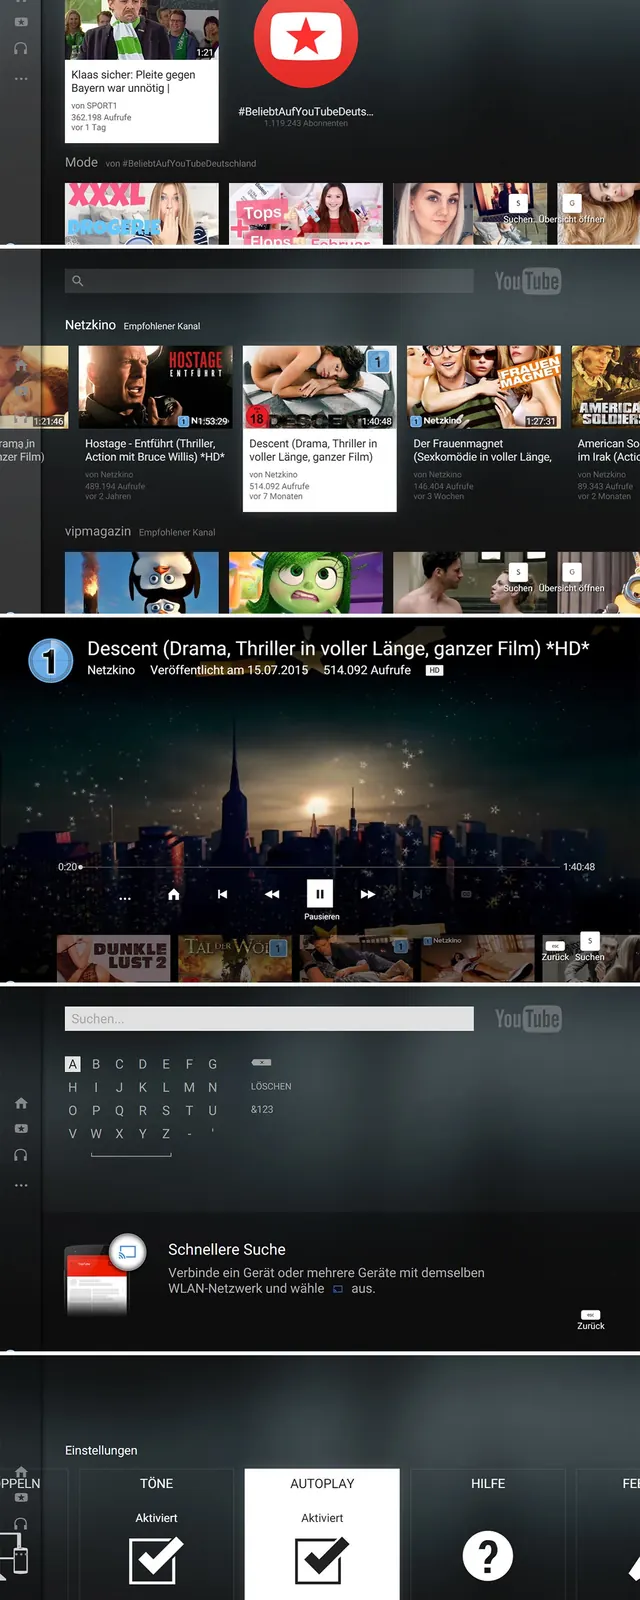 UI/UX Dashboard and App Interface Mockups
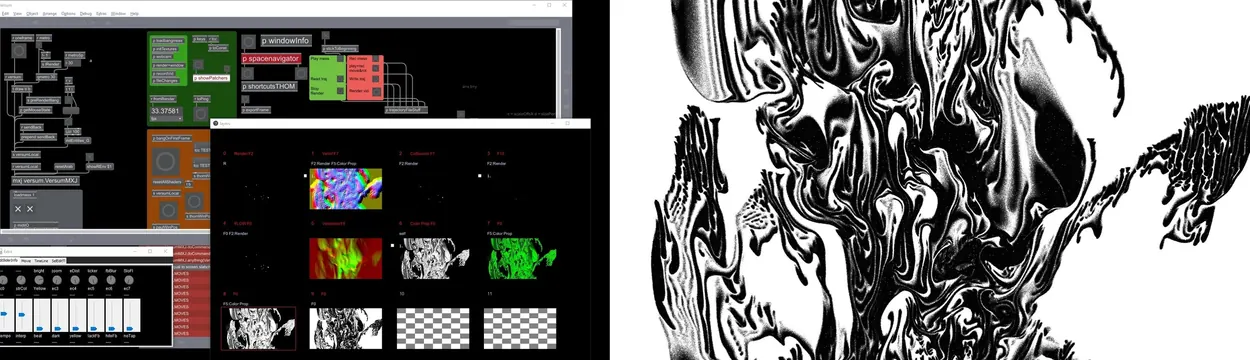 Data Visualization and Abstract Fluidity Design
 Types of Lightbulbs comparison infographic
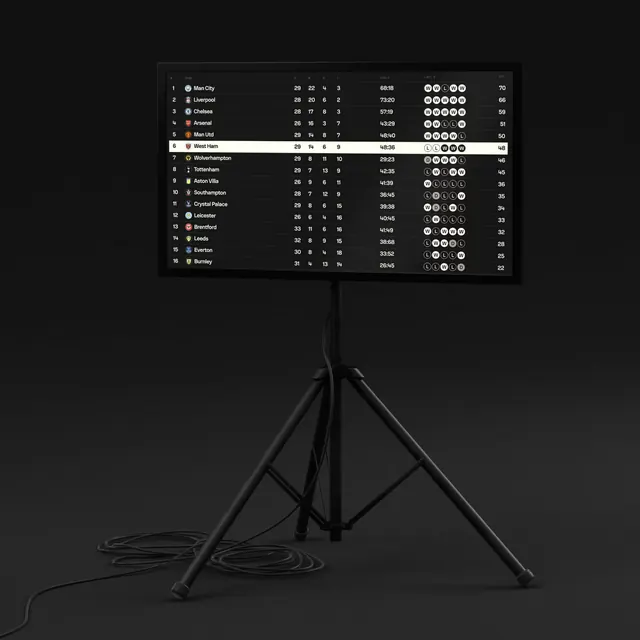 Dark Mode Dashboard Mockup
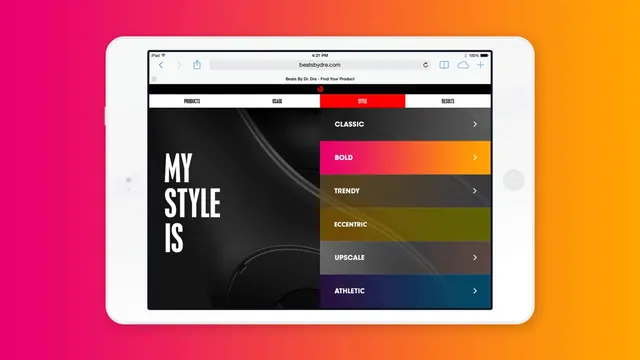 My Style UI Design Reference
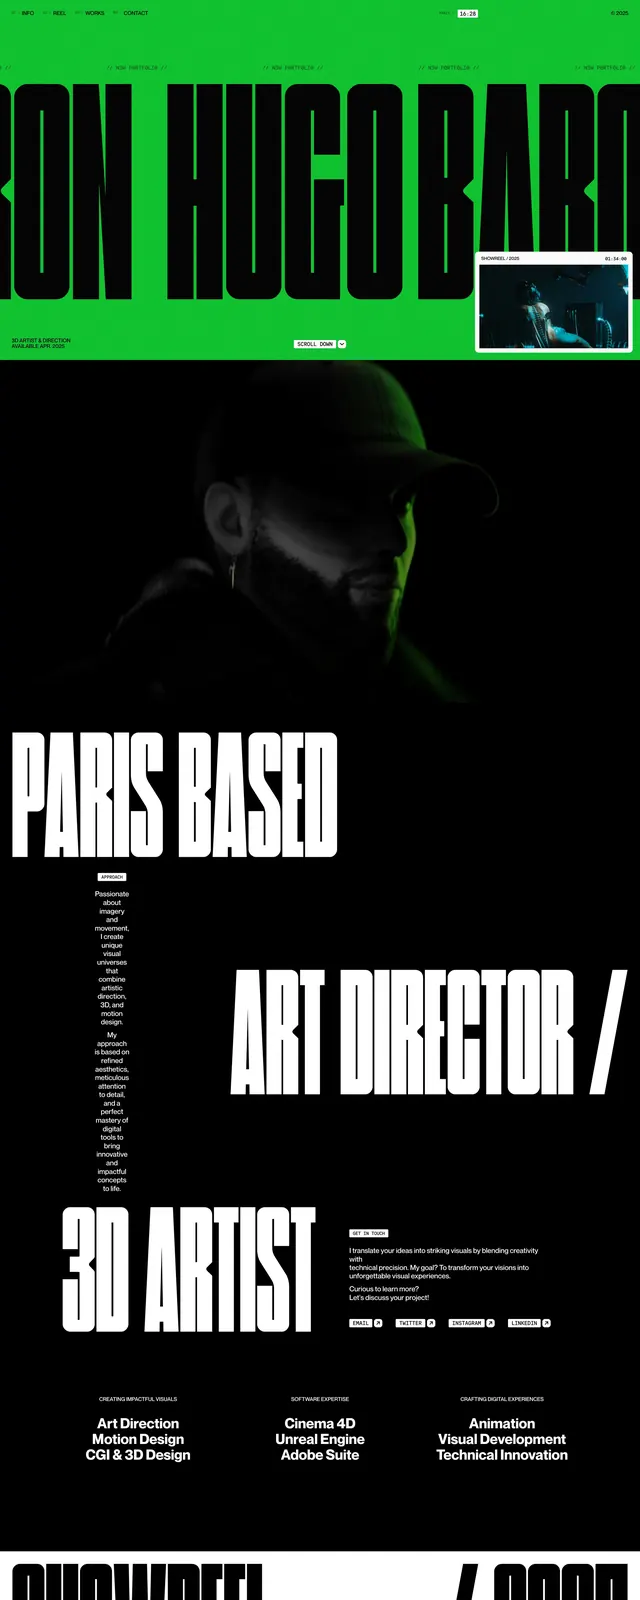 Technical Data Dashboard Layout
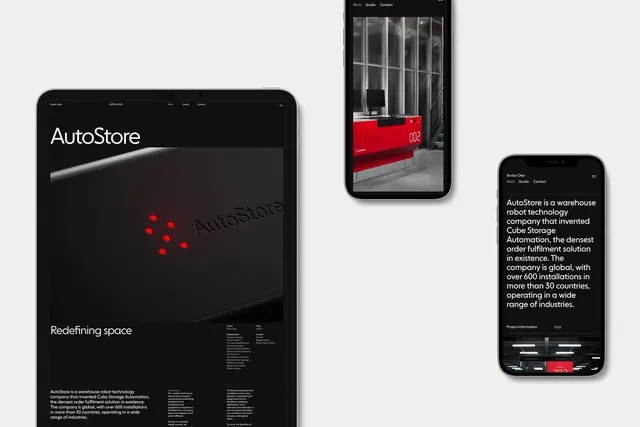 AutoStore Branding and UI Mockups
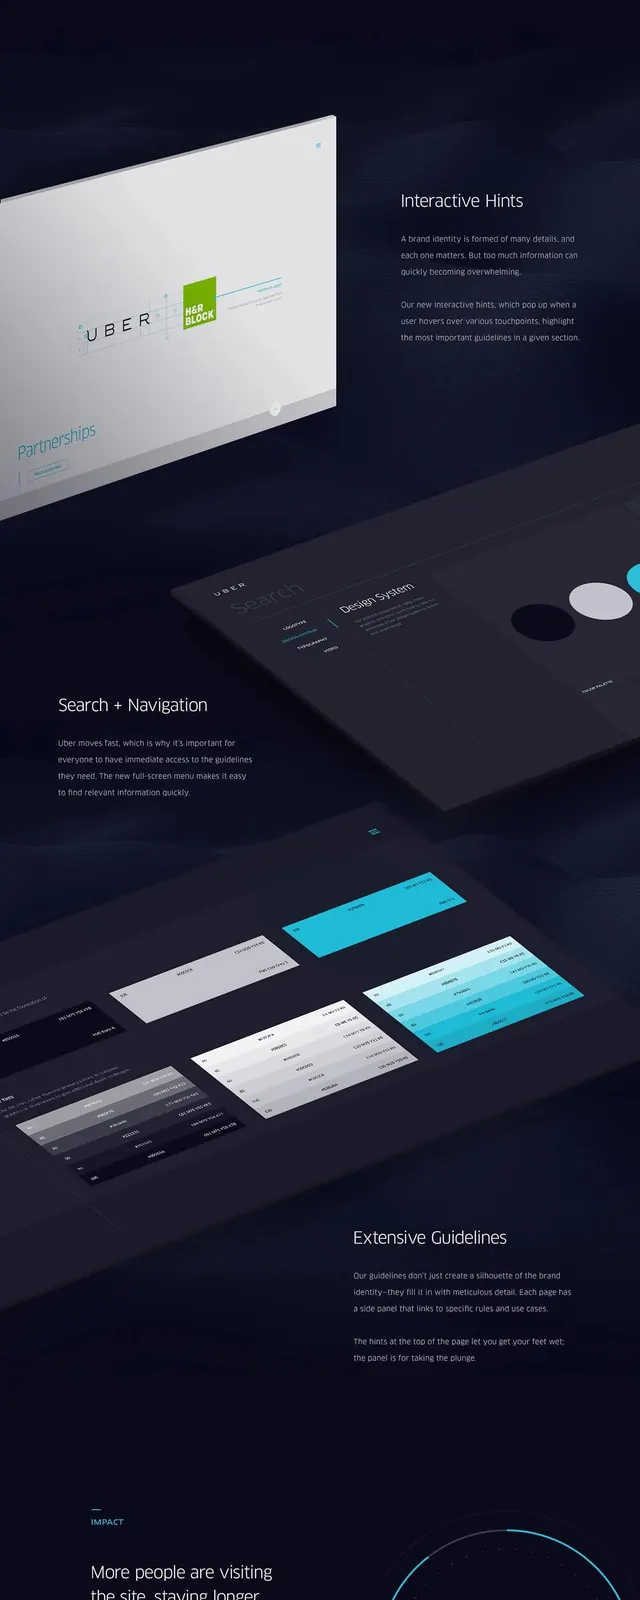 Dark Mode SaaS Dashboard Showcase
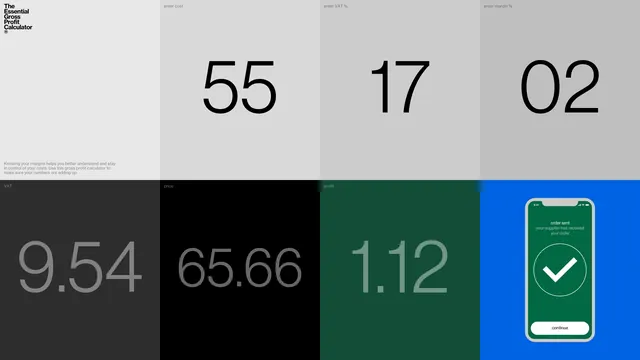 Data Dashboard Interface
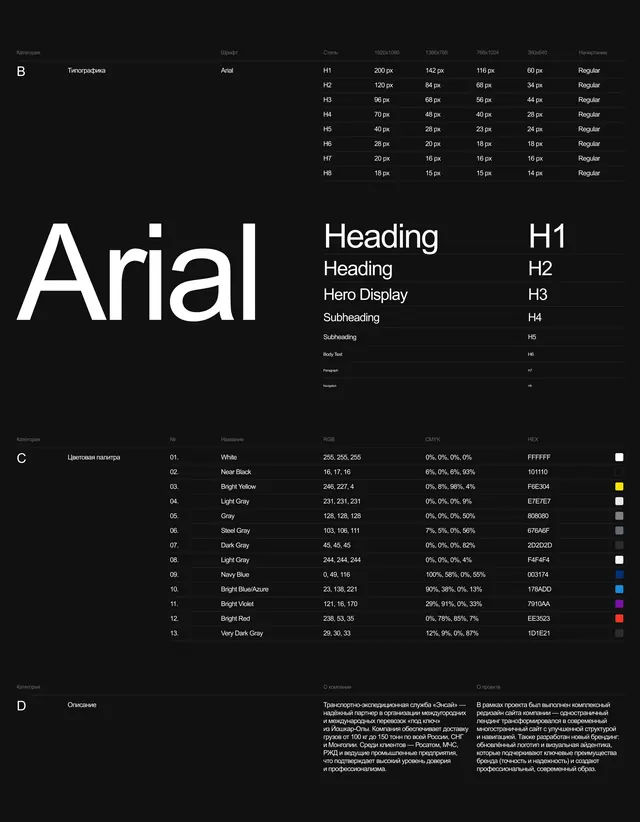 Arial Type Specimen and Data Visualization Layout
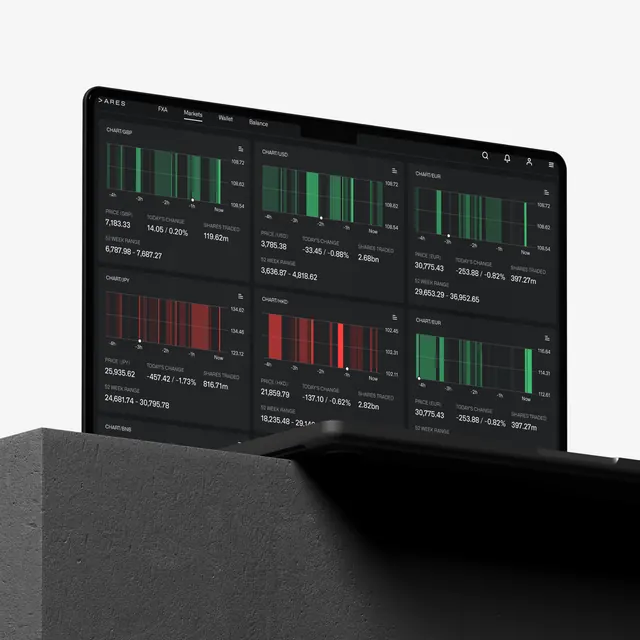 Data Dashboard Interface
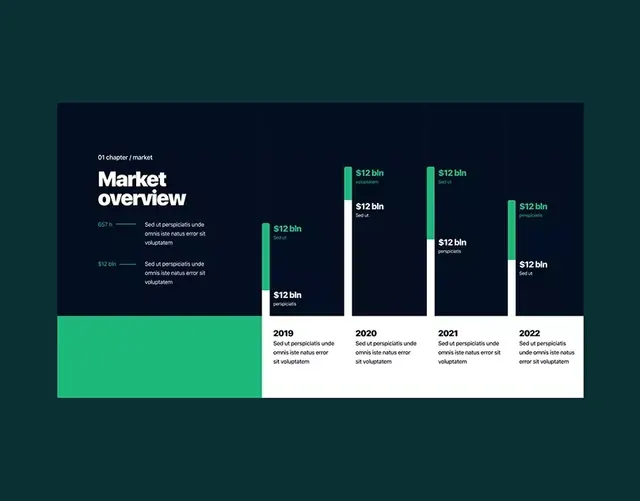 Market overview financial data dashboard
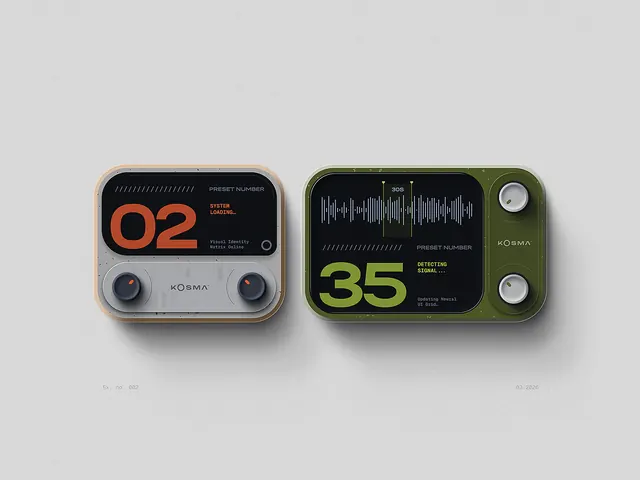 Smartwatch Interface Mockup
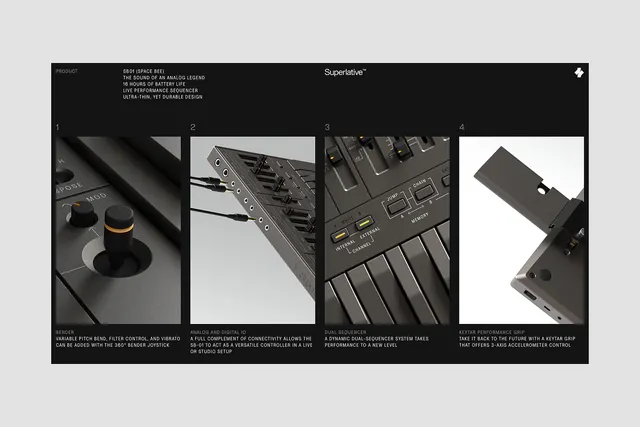 Technical UI and Hardware Mockup Showcase
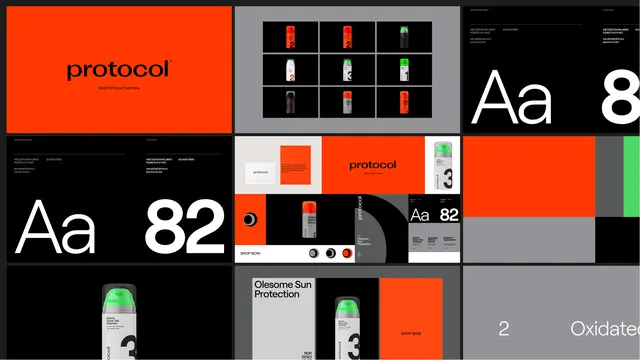 Protocol Identity System and Typography Layout
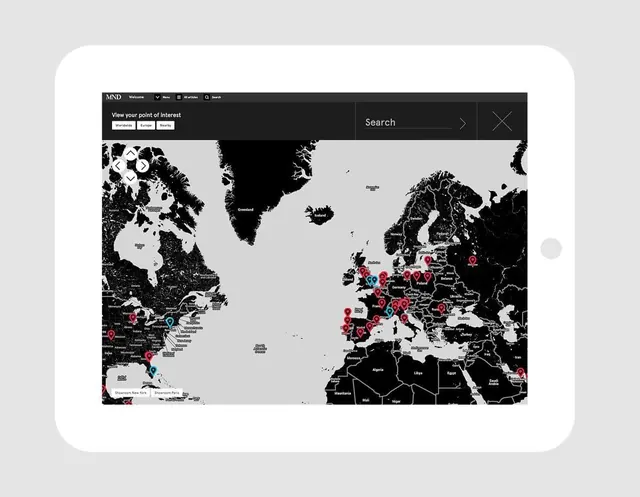 Global Data Map Interface
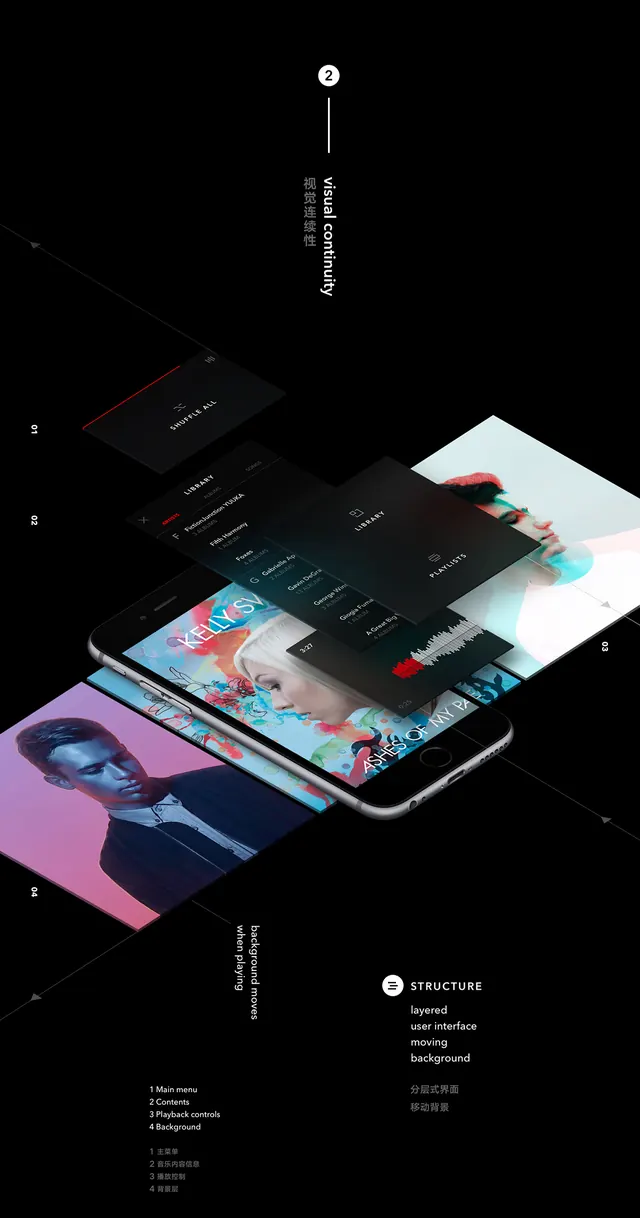 Dark Mode UI Dashboard Mockup
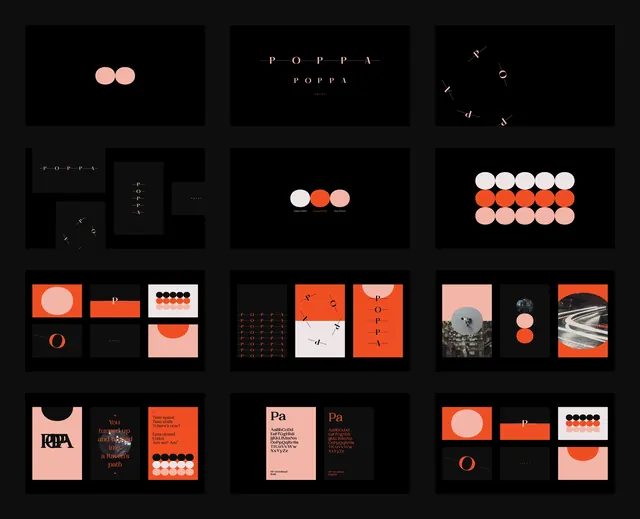 Minimalist Geometric Identity System
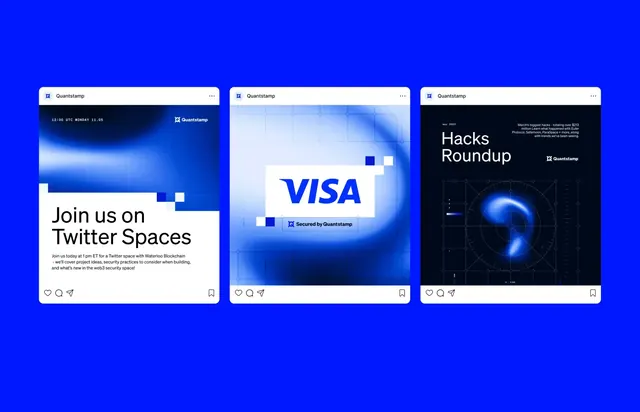 Three-card dark blue UI mockup set