Data Visualization Dashboard
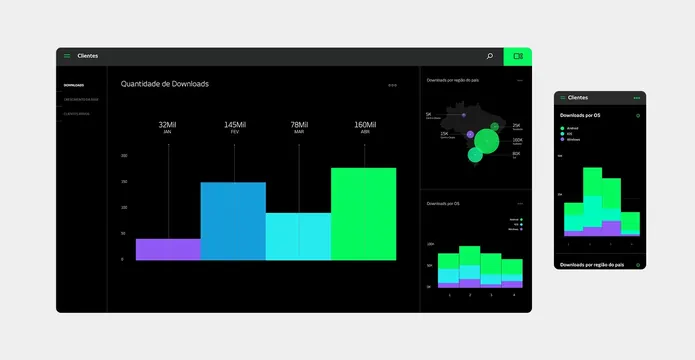
A dark-mode analytics dashboard featuring a large bar chart and a smaller secondary chart with vibrant neon accents.
Summary
A dark-mode analytics dashboard featuring a large bar chart and a smaller secondary chart with vibrant neon accents.
Visual description
The design features a dark background with high-contrast neon green, blue, and purple bars. It includes a large primary bar chart and a smaller secondary chart with a circular data point.
Key takeaway
The use of vibrant neon colors against a dark background creates a high-impact, modern aesthetic for data readability.
Reuse notes
This layout can be adapted for any SaaS analytics platform or financial reporting tool.
StyleMinimal, Dark Mode, Corporate Clean, Geometric, Flat
TypeSans Serif
MoodProfessional, Technical, Trustworthy
IndustryAnalytics, Data, Fintech, Productivity, Saas
Palette
#EBEBEB
#08090A
#1AD69E
More like this
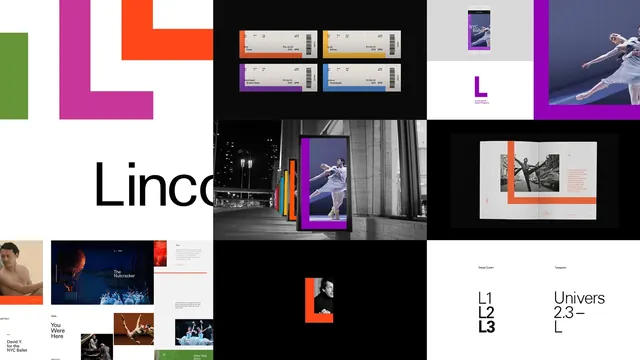 Geometric and Typographic Identity System
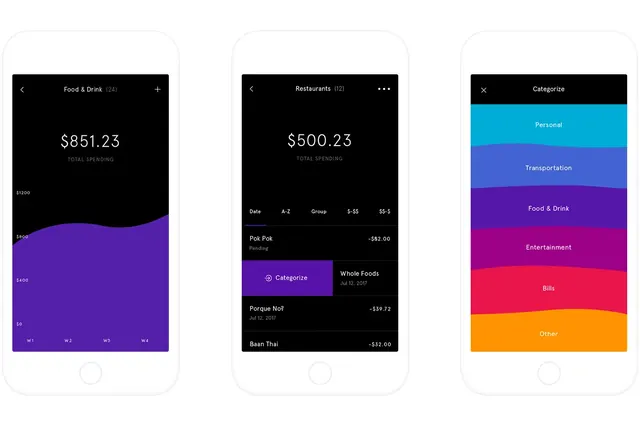 Mobile App UI Design Variations
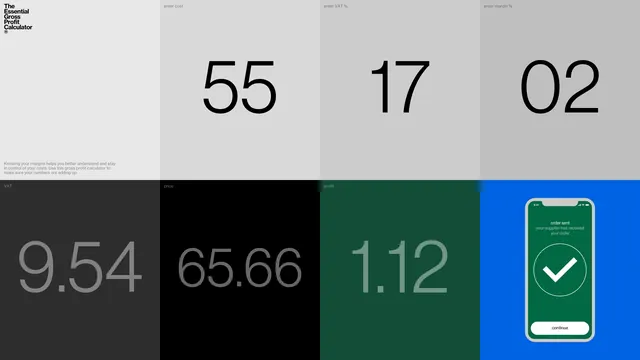 Data Dashboard Interface
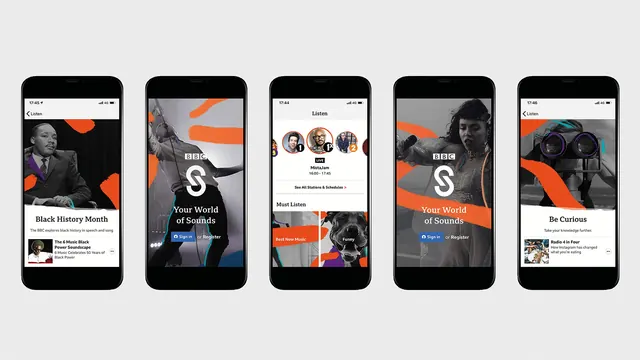 S-branded App Interface Mockups
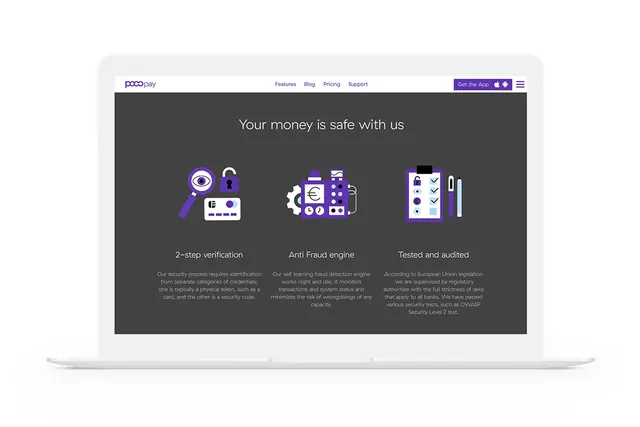 Security Dashboard UI
 Tablet Dashboard Interface
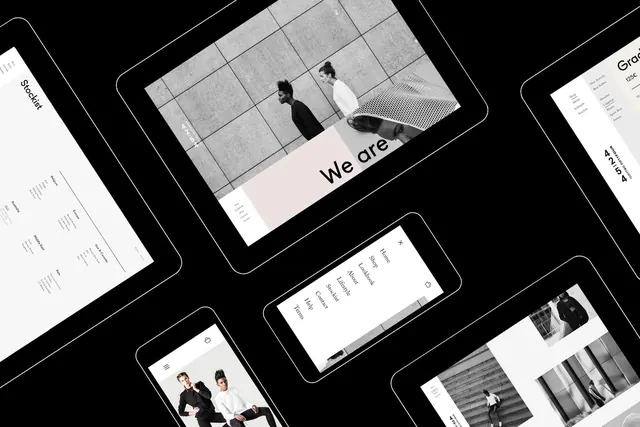 Modern UI/UX Design Mockup Collection
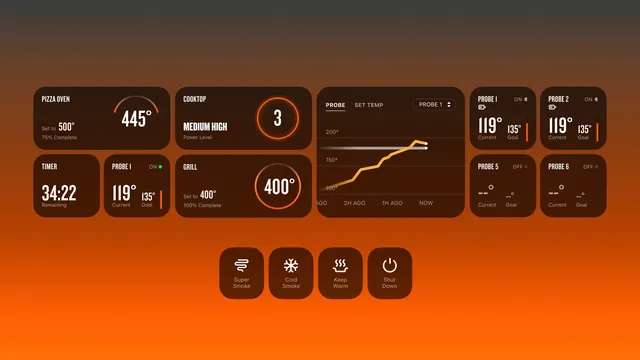 Data Dashboard Interface
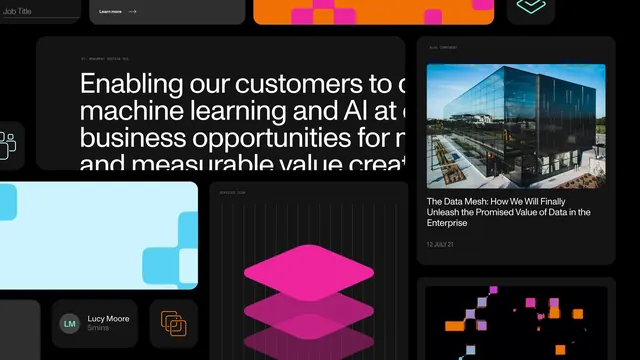 AI product interface, dark with neon gradient accents
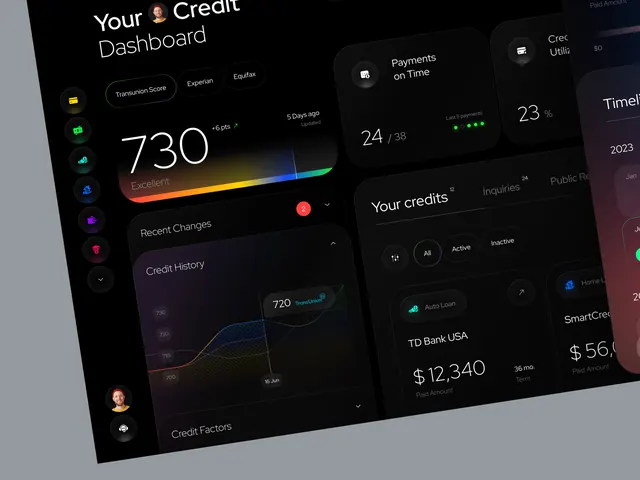 Fintech Dashboard UI Design
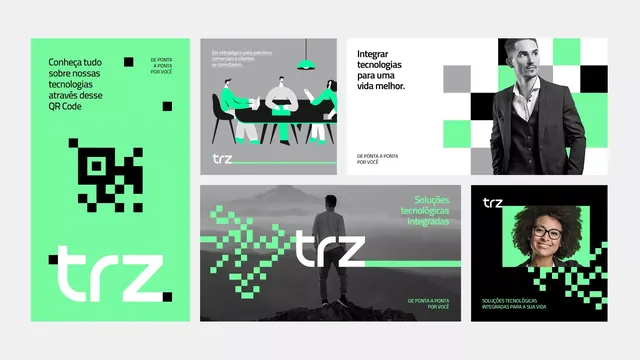 Tech brand identity system with neon accents
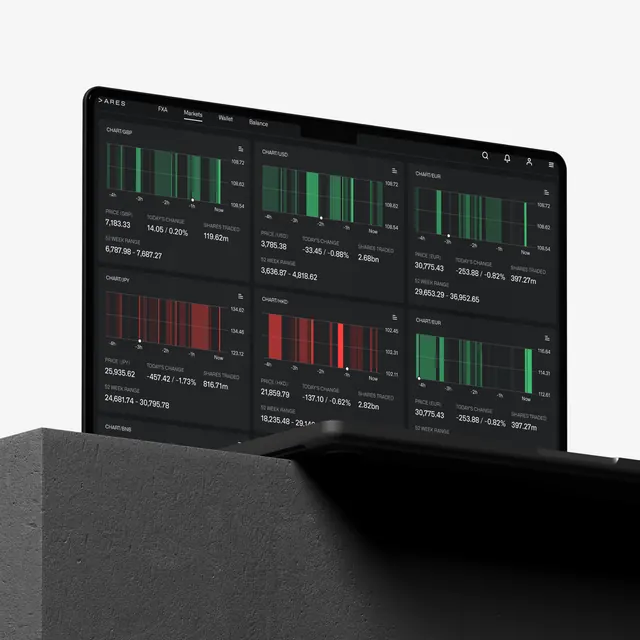 Data Dashboard Interface
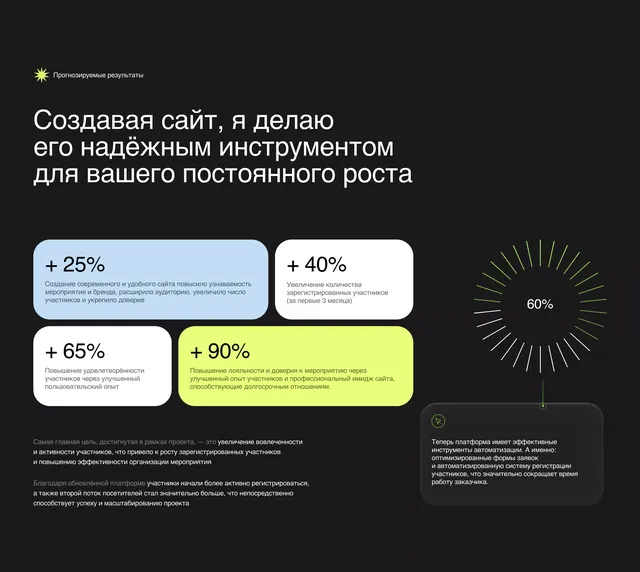 Dark dashboard with neon metric cards and circular gauge
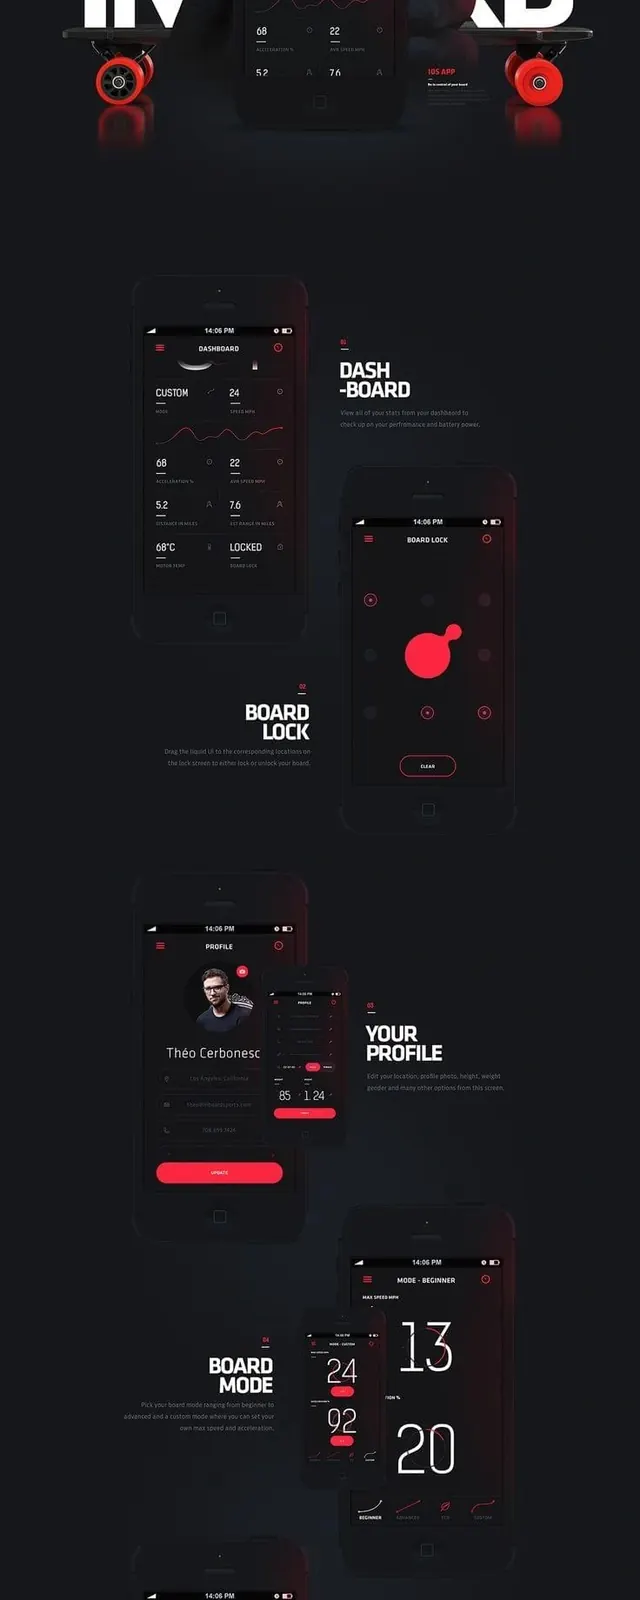 Dark Mode Data Visualization Dashboard
 Fintech Card Balance UI Card
 Desktop Monitor UI Mockup
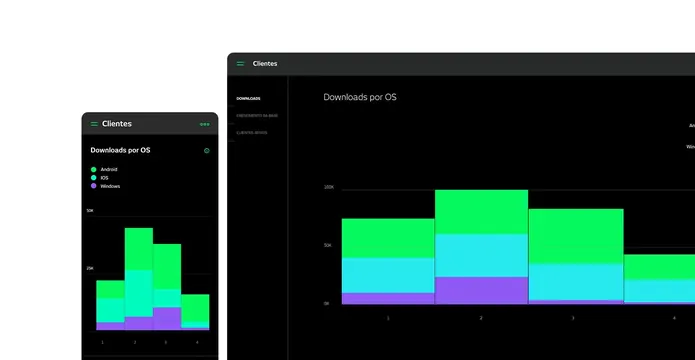 Data Visualization Dashboard
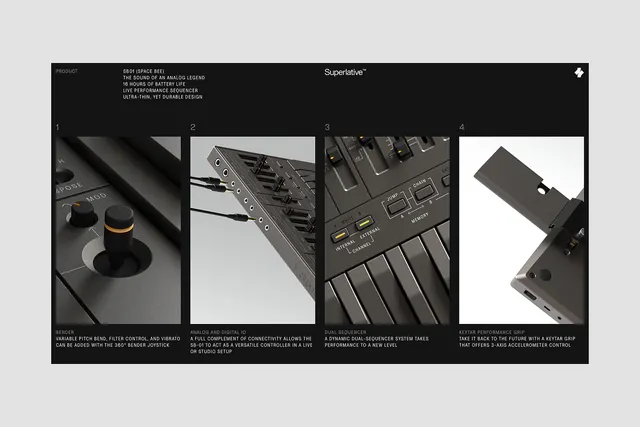 Technical UI and Hardware Mockup Showcase
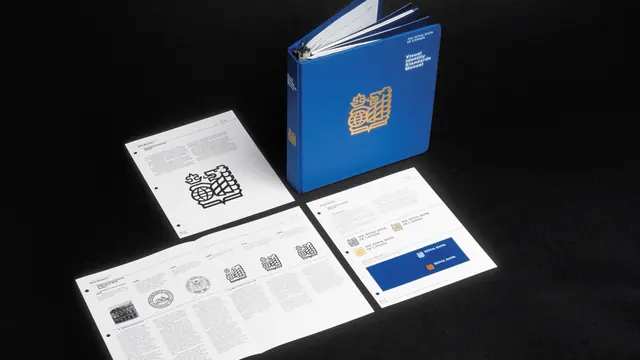 Corporate Identity and Editorial Layout Mockup
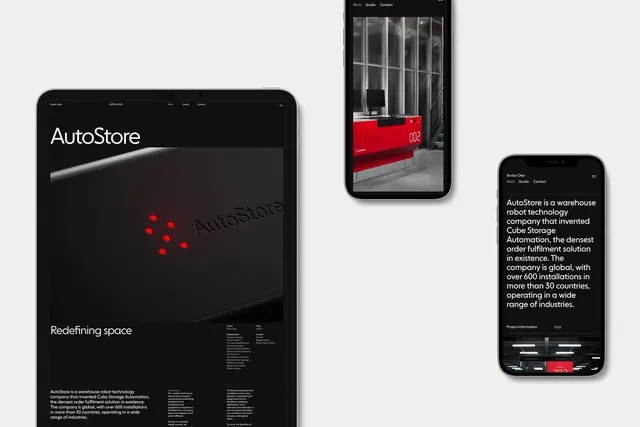 AutoStore Branding and UI Mockups
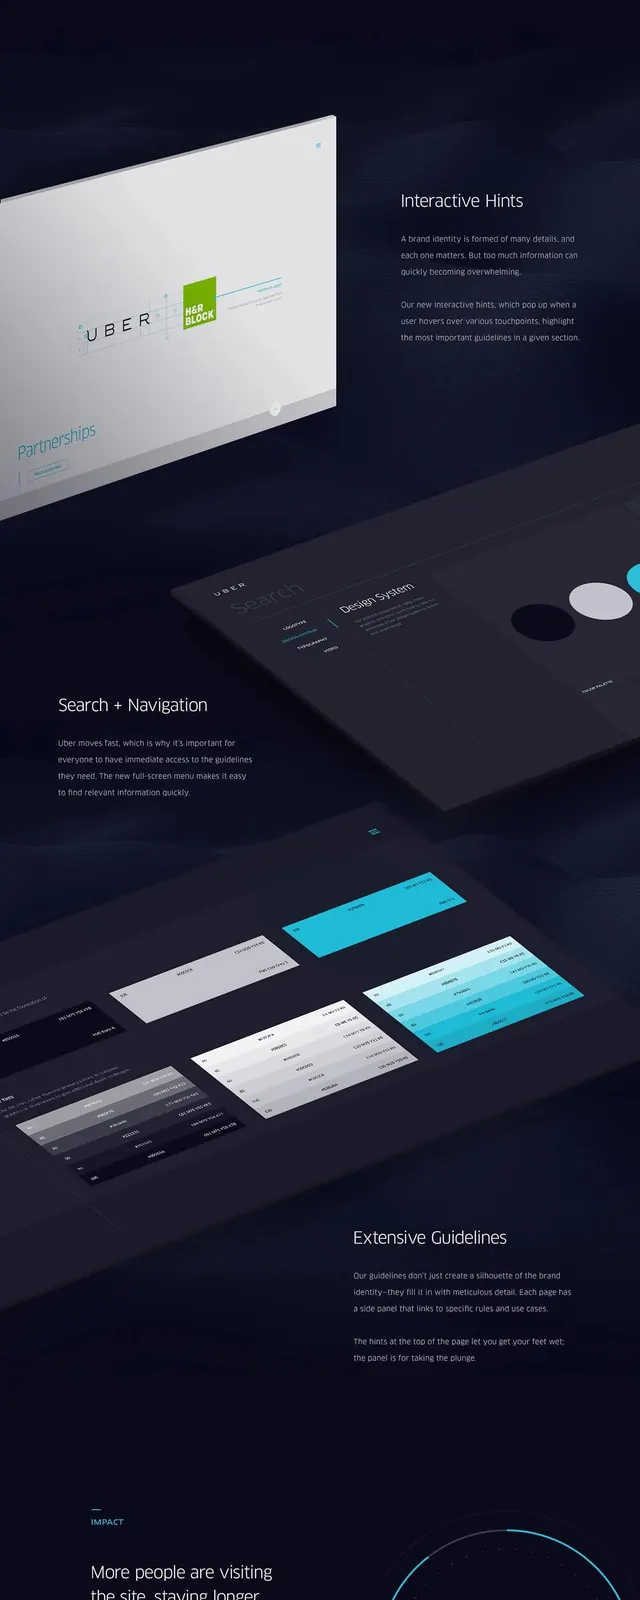 Dark Mode SaaS Dashboard Showcase
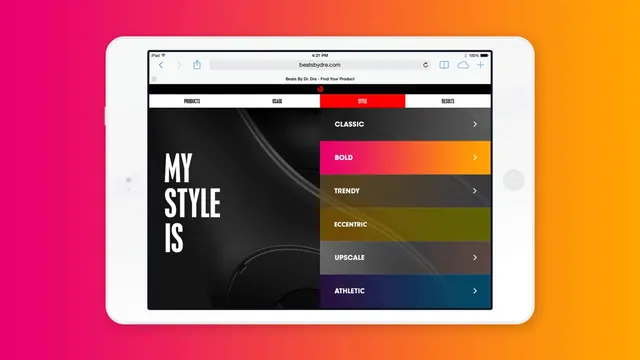 My Style UI Design Reference
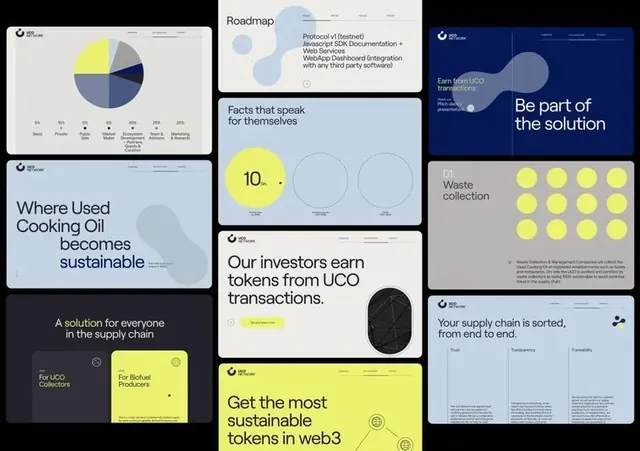 Web3 sustainability dashboard with neon accents
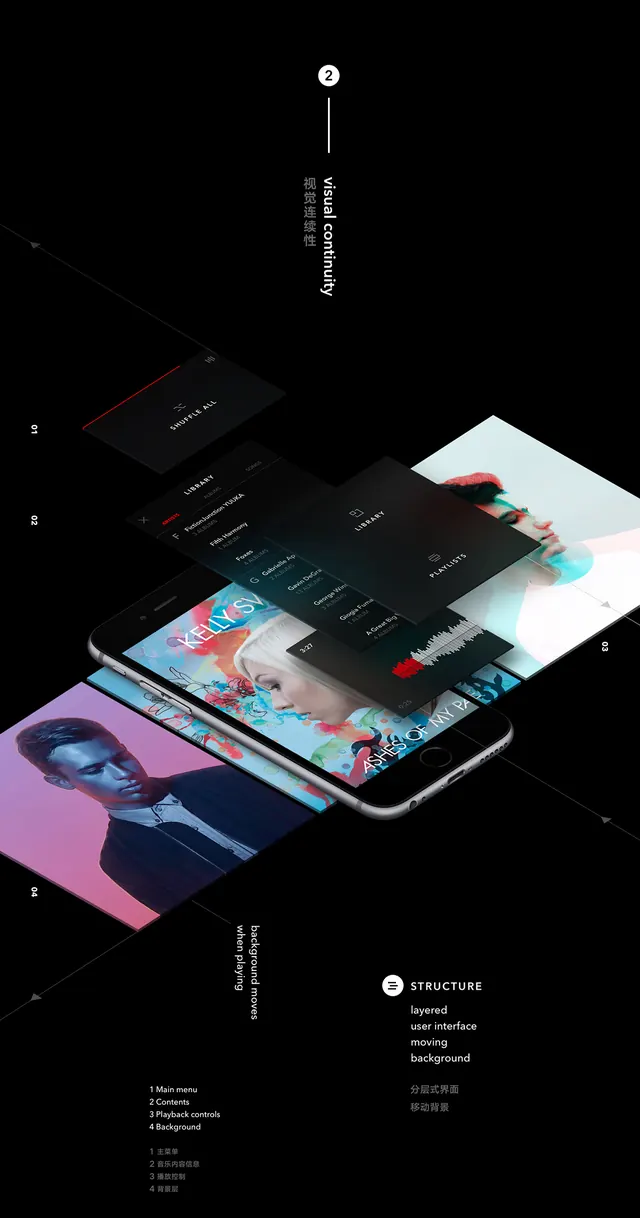 Dark Mode UI Dashboard Mockup