Globe grid data visualization
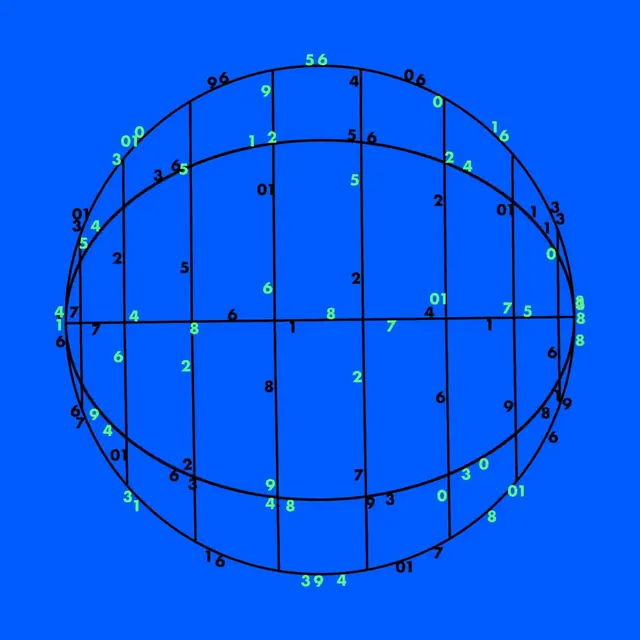
Technical infographic showing a wireframe globe grid with coordinate labels on a solid blue background, depicting global data or mapping.
Summary
A technical data visualization showing a wireframe globe with latitude/longitude grid lines and numbered coordinate labels, rendered on a vibrant blue background.
Visual description
A three-dimensional wireframe representation of a globe is drawn with black lines showing meridians (north-south) and parallels (east-west). Latitude and longitude values are marked around the perimeter and at grid intersections in small monospace numerals (e.g., "39.4", "0°"). The globe is oriented with the equator visible and grid squares created at regular intervals. The background is a flat, saturated blue color. The contrast between the precise grid lines and the round form of the globe is striking. The technical notation and precise geometry convey data visualization and geographic information.
Key takeaway
Wireframe globe visualizations effectively communicate geographic data, mapping, and global concepts. The grid structure adds technical credibility. Monospace type reinforces the data-driven nature.
Reuse notes
Strong for tech, data science, finance (forex/global markets), logistics, or climate-related content. Can work as a background element or standalone infographic. The blue background is conventional for geographic/data contexts. Scale coordinates and grid density based on the level of detail needed.
More like this
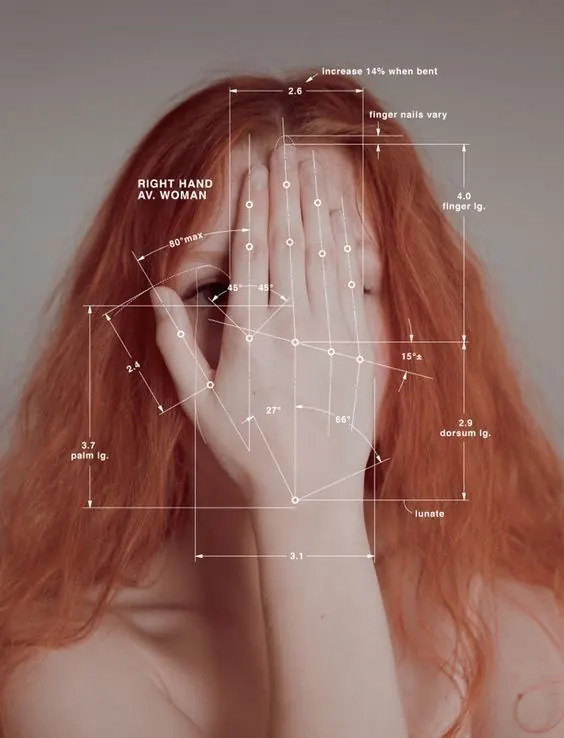 Hand anatomy measurement diagram
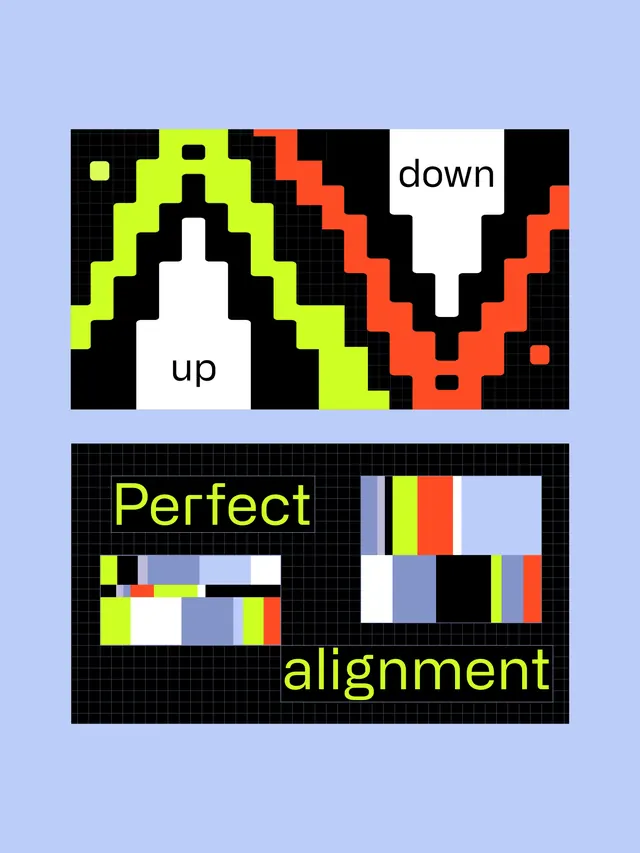 Styleframes: motion design infographic series (slide 8)
 Botanical Silhouettes Rendered as Waveform Strokes
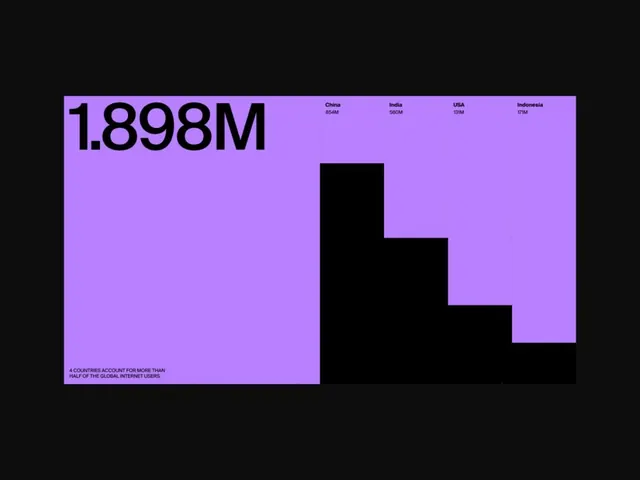 Infographic data-dense infographic
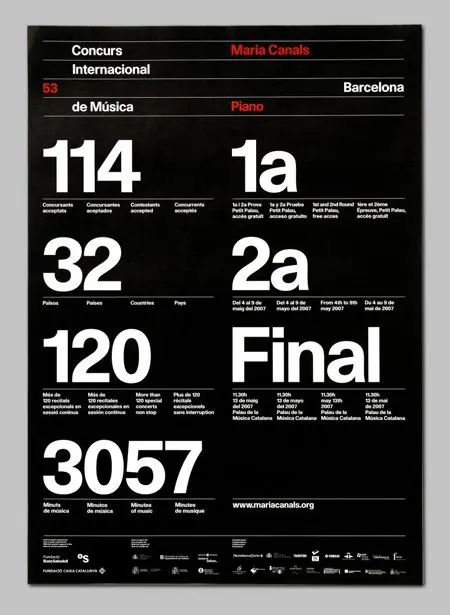 Concerts Internationaux Piano Scoreboard
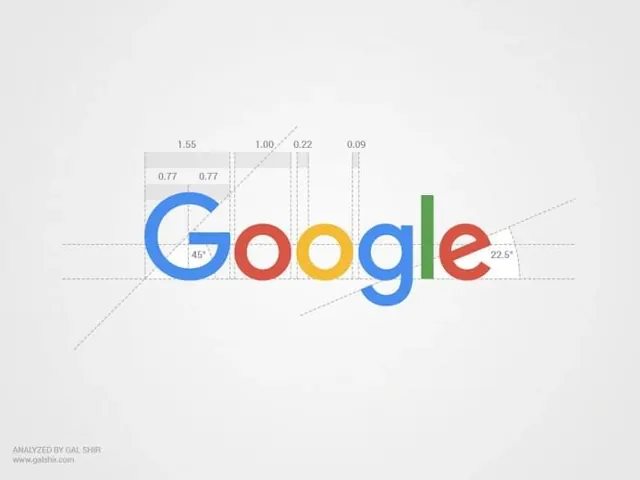 Google Logo Data Visualization
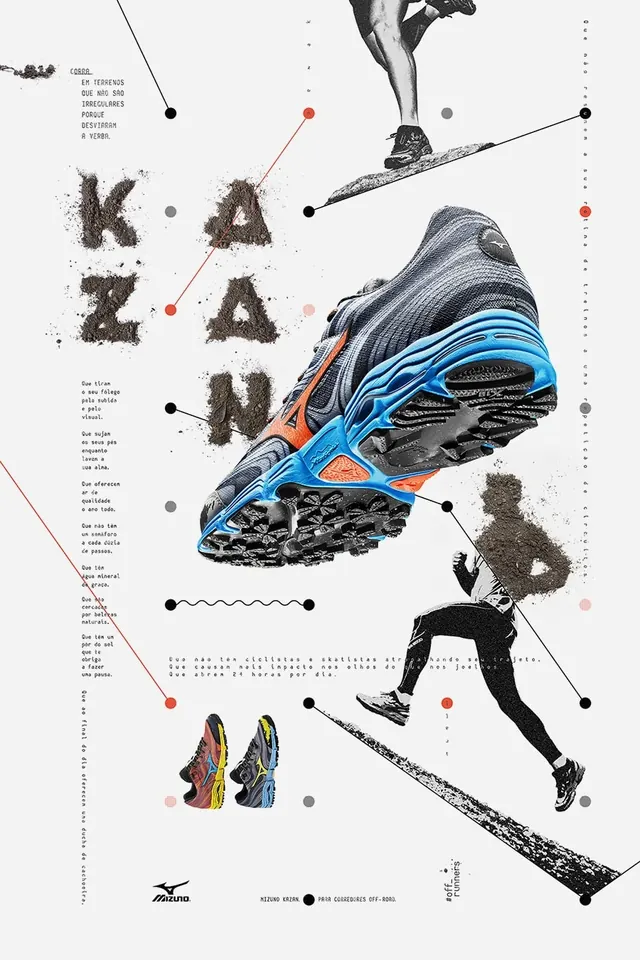 Running shoe product infographic
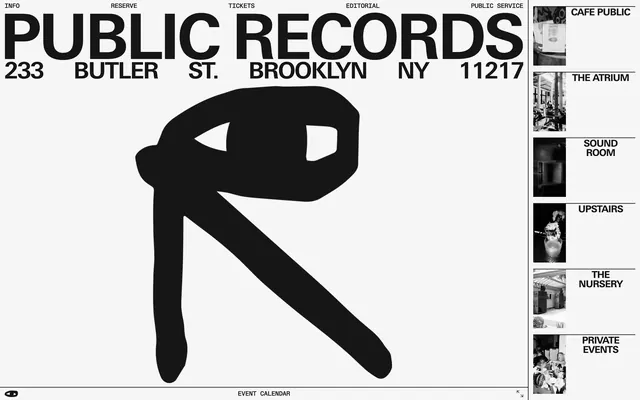 Information-dense wayfinding and layout system
 Data-dense infographic infographic
 Dark map infographic with neon highlight
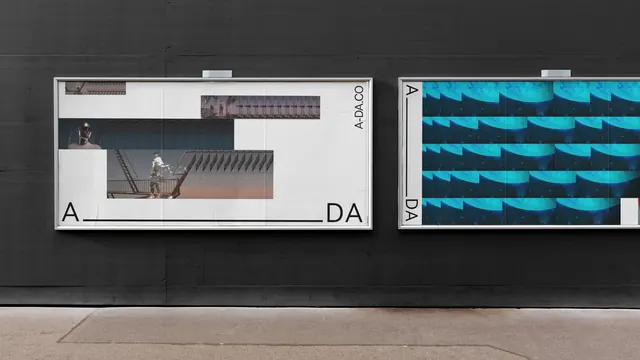 Abstract Data Visualization and Geometric Pattern Design
 Boeing 747-400 red typographic spec poster
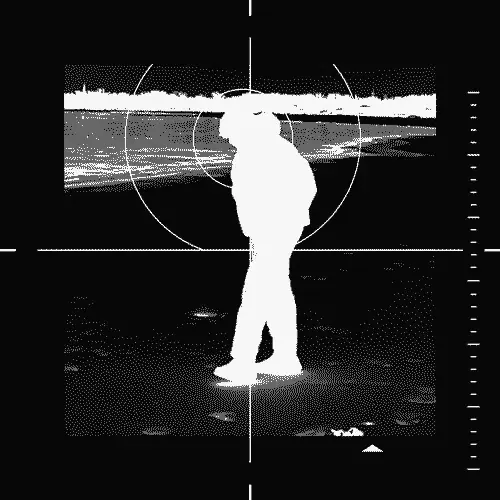 Data visualization - figure with information streams
 Dense data visualization with Korean text labels
 CRAFTED event visual identity and motion system (slide 7)
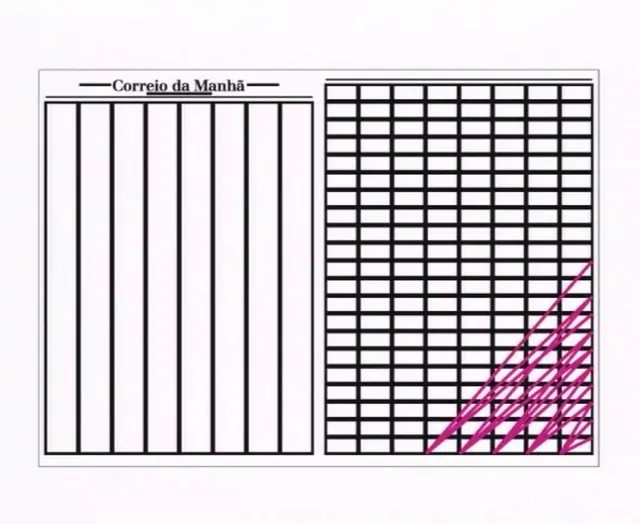 Newspaper visualization chart with grid and diagonal hatching
 GN–S search system pictogram grid
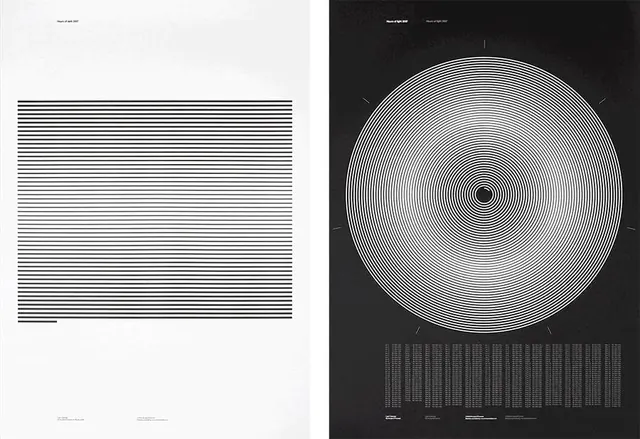 Linear patterns and circular concentric design
 Tinker anchors and fasteners product guide
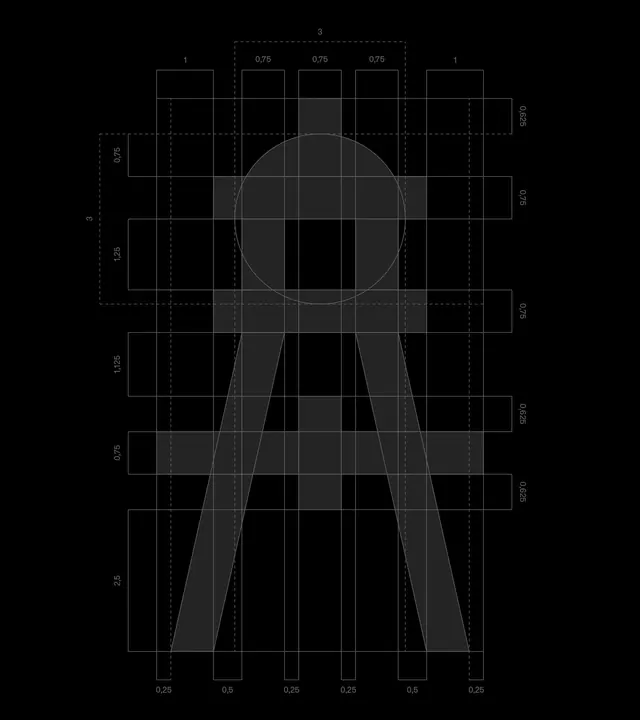 Modular grid system with proportional anatomy
 Anatomical brain diagram with grid system
 Typography specimen with diagonal stripes and blue block
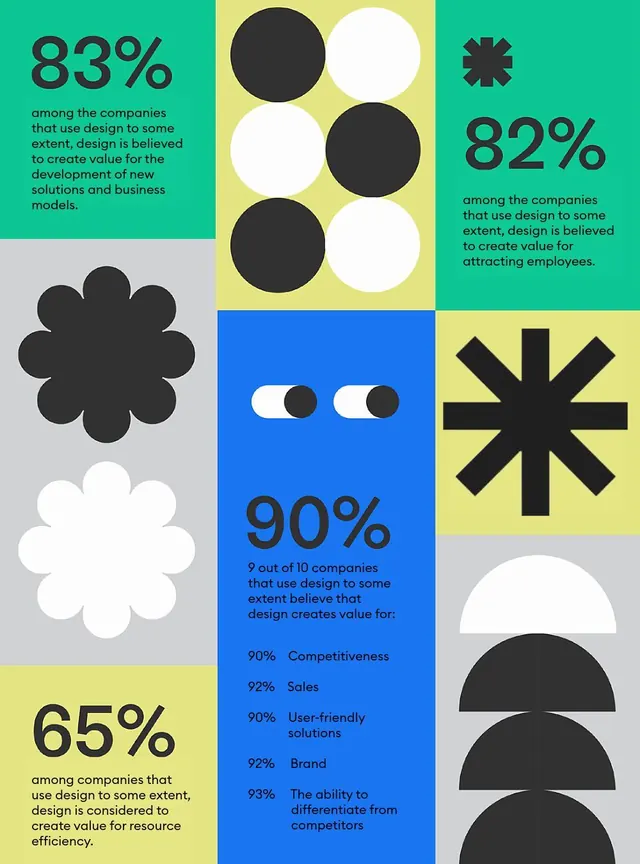 Data-dense infographic infographic
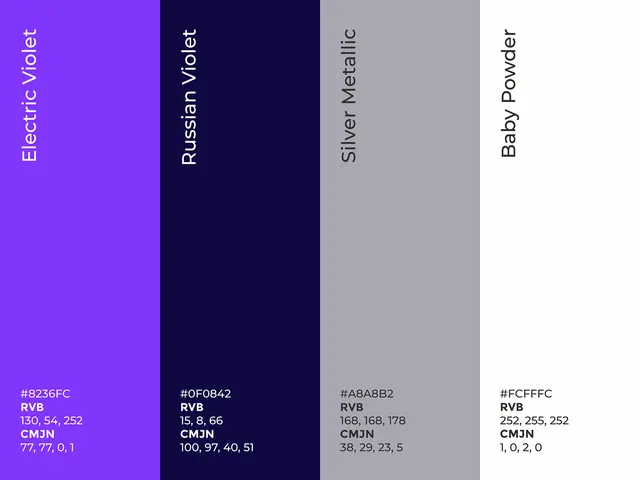 Cool-toned tech color palette: electric violet to silver to powder