Dark map infographic with neon highlight
Dark-themed map visualization with black and grey tones and a single neon blue rectangular region highlighted, featuring minimal navigation and coordinates.

Summary
Dark-themed map visualization with black and grey tones and a single neon blue rectangular region highlighted, featuring minimal navigation and coordinates.
Visual description
A dark interface showing a stylized world map rendered in blacks and dark greys with white outlines. A single bright neon-blue rectangular area is overlaid on the map as a focal point. Navigation elements include 'TWEET NOW' at bottom left and coordinate data. Text in all-caps, sans-serif. The design uses extreme contrast between the dark base and the bright blue selector.
Key takeaway
Using a single neon accent color against a dark background for emphasis; applying minimal interface design with clear hierarchy through extreme contrast.
Reuse notes
Ideal for tech dashboards, location-based applications, geospatial tools, or data analysis UIs. The neon accent technique works well for highlighting specific data points or regions. Works best on dark-theme interfaces.
More like this
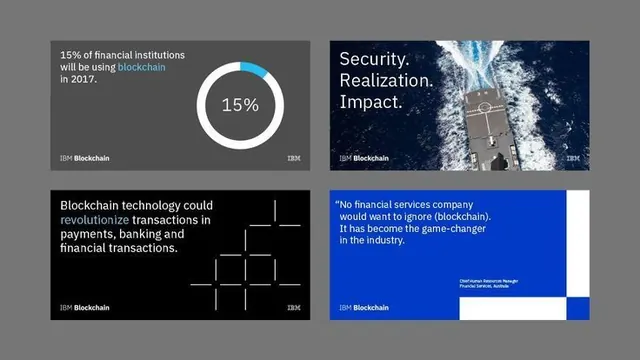 Minimal corporate-clean data viz
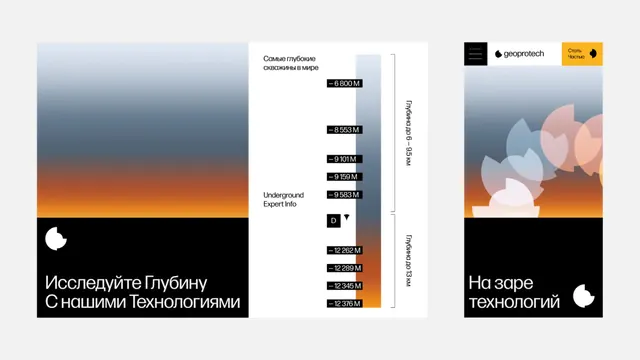 Infographic gradient-heavy infographic
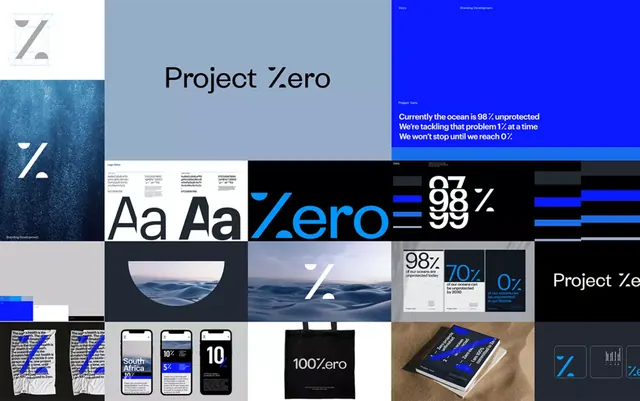 Minimal dark-mode data viz
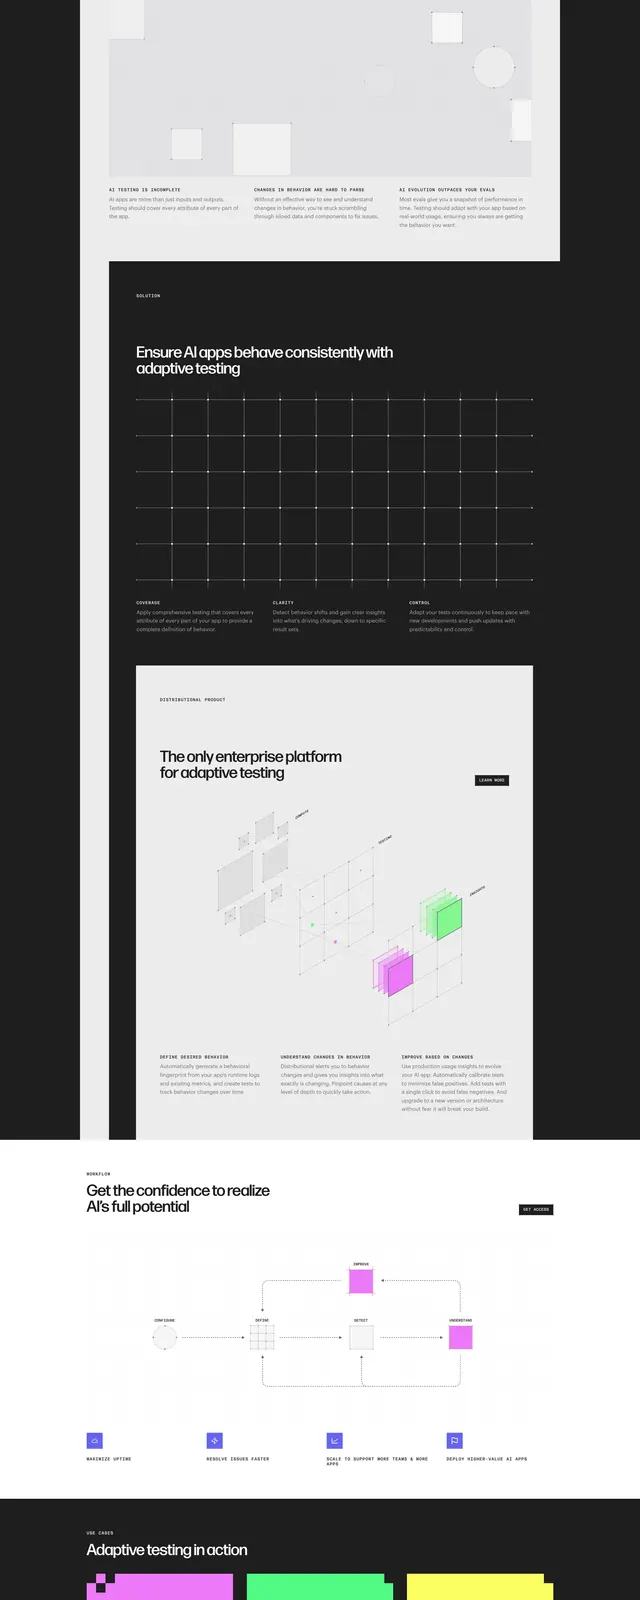 Distributional dark AI hero
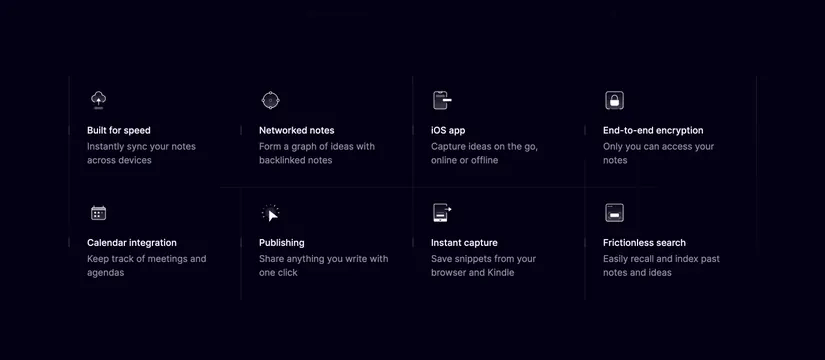 Reflect eight-feature dark grid
 Dark-mode minimal data viz
 Corporate-clean data-dense data viz
 Reflect about indie global team
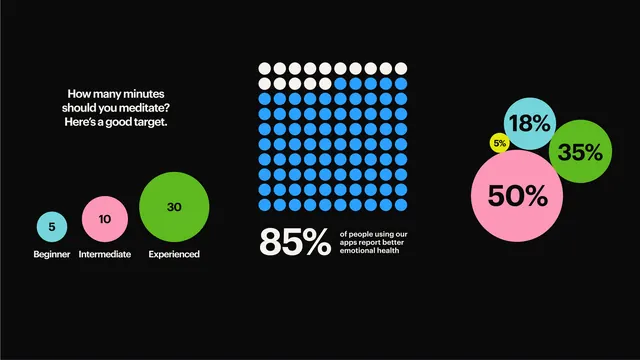 Data-dense infographic infographic
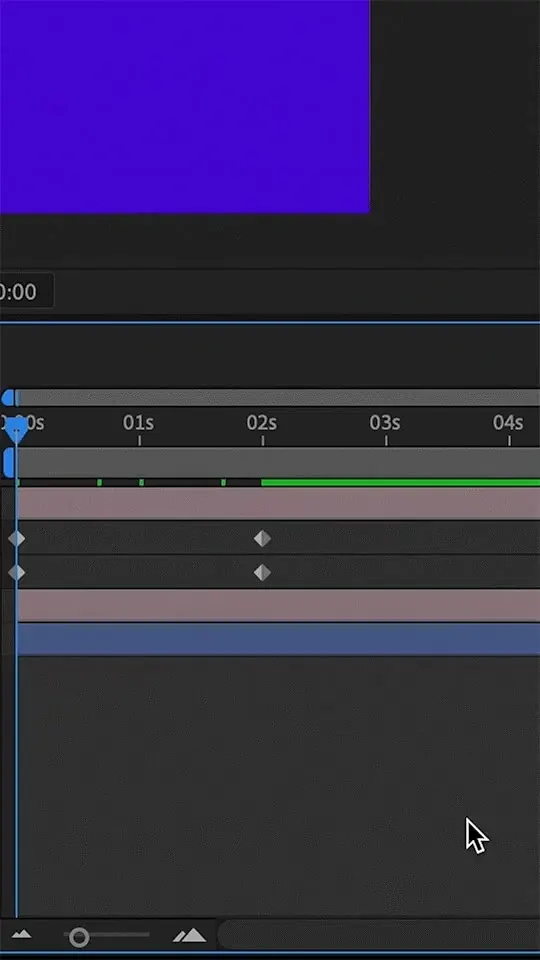 Video editing interface motion design
 Riotters toolbox and tool logos
 CRAFTED event visual identity and motion system (slide 7)
 Dark Mode UI Dashboard Interface
 Atlantic Venture Capital Landing Page
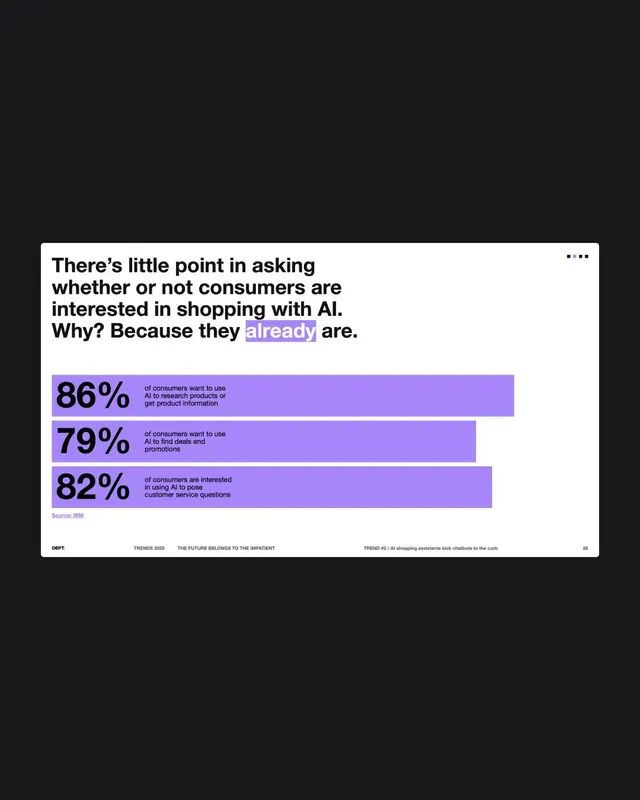 Data-dense minimal infographic
 Minimal dark-mode data viz
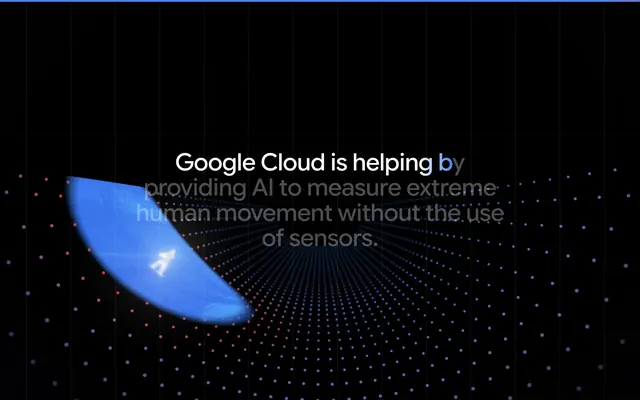 Google Cloud AI movement visualization hero
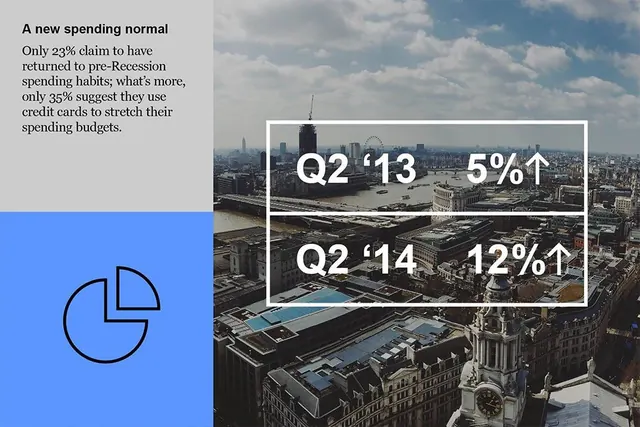 Infographic corporate-clean infographic
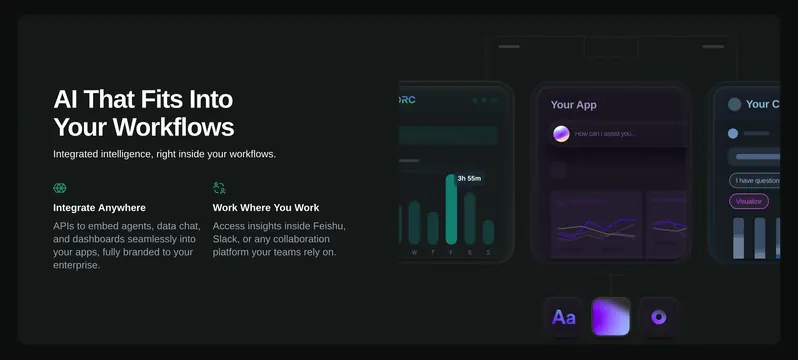 ReOrc AI workflow integration feature
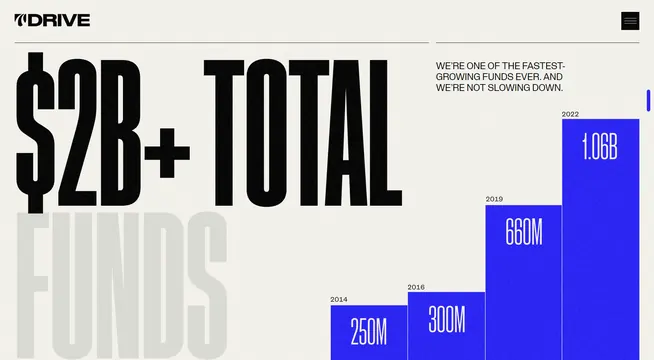 Minimal corporate-clean data viz
 The Grid fungibility value proposition
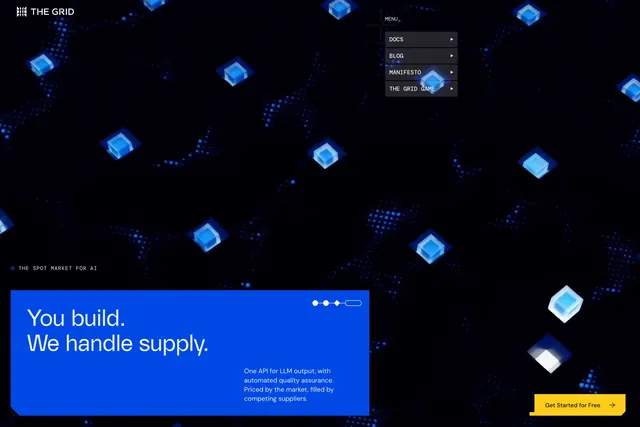 The Grid spot market hero
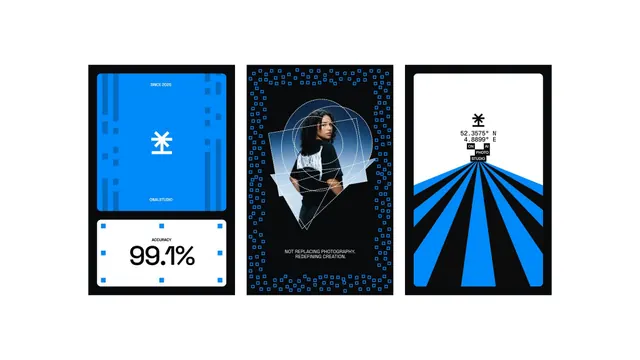 Minimal geometric data viz
 Superchat integrations hero