Valley reply-rate bar chart paired with a testimonial
A light, data-led comparison that benchmarks the brand against named competitors in a bar chart, with a gradient testimonial card validating the headline number.
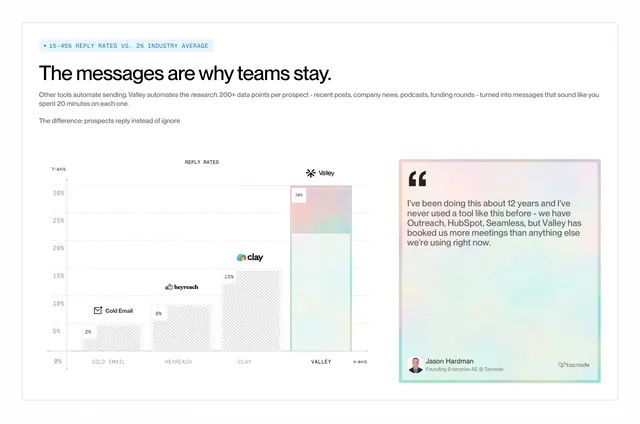
Summary
A comparison built on an actual chart: a reply-rate bar graph ranks the brand well above named competitors, sitting beside a single gradient-bordered testimonial that backs up the claim.
Visual description
White background patterned with faint dots. A highlighted monospace eyebrow states a metric ("15-45% reply rates vs 2% industry average") above a bold sans headline ("The messages are why teams stay.") and two lines of body copy. Lower left is a labelled bar chart with x and y axes: four bars rising from Cold Email (2%) to HeyReach (8%) to Clay (15%) to a tallest, gradient-filled Valley bar (30%), each topped with the competitor's small logo. Lower right is a tall testimonial card with a soft rainbow-gradient border holding a multi-line quote, an avatar, a name and title, and a company logo.
Key takeaway
Making the comparison literally a chart so the gap is felt, not just claimed, then placing one testimonial right beside it so proof and praise read together. The monospace eyebrow and axis labels lend a credible, analytical tone.
Reuse notes
Use when you have a defensible quantitative edge and are willing to name competitors. Bars topped with real competitor logos raise the stakes, so be sure the numbers are sourced. The gradient card adds warmth to an otherwise clinical layout; keep it to one quote so it does not compete with the chart.
More like this
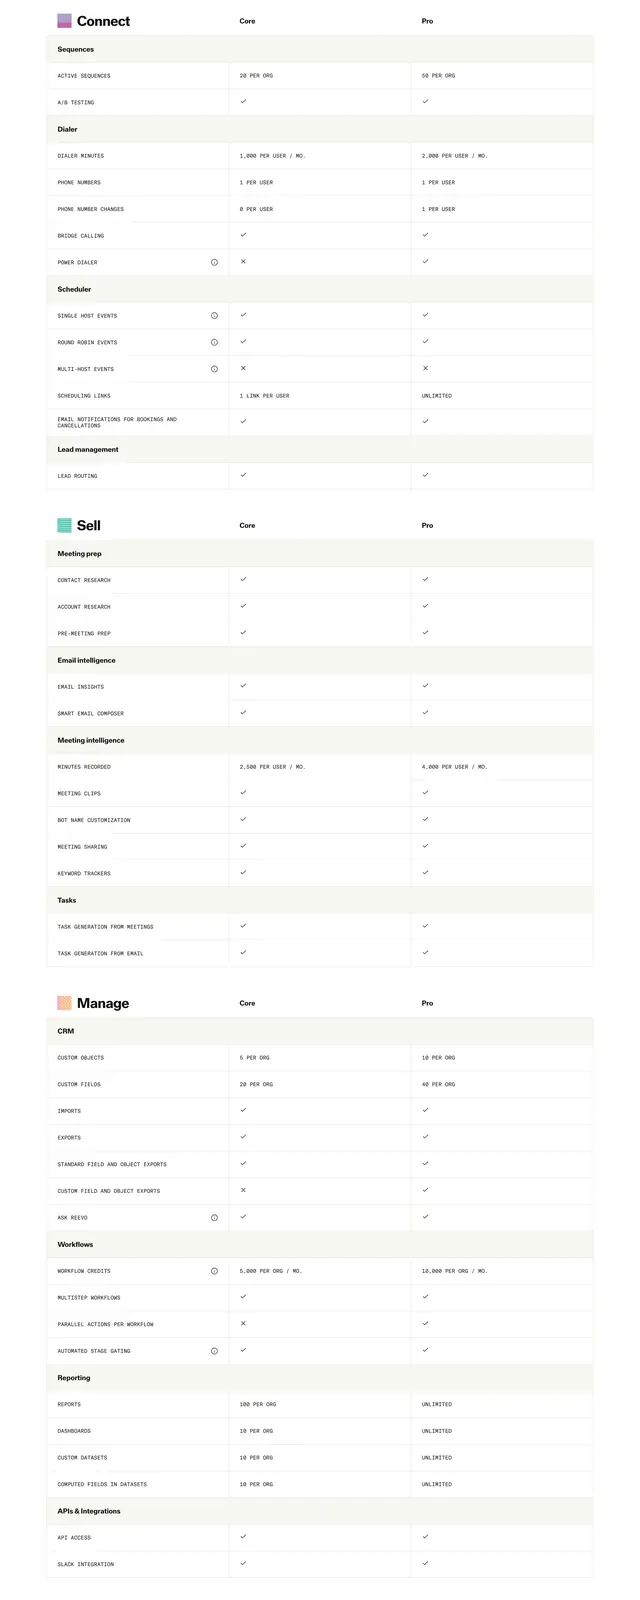 Reevo Core vs Pro comparison table
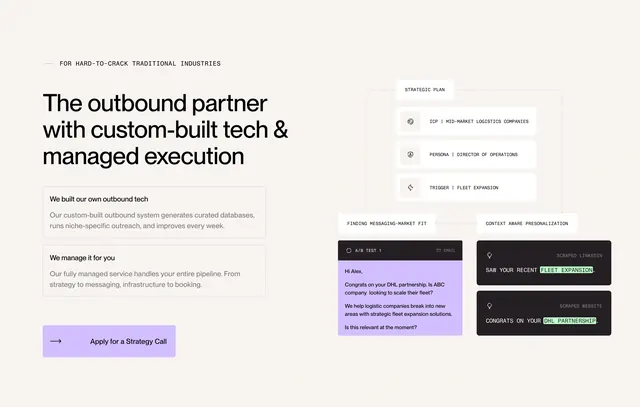 Throxy outbound partner feature diagram
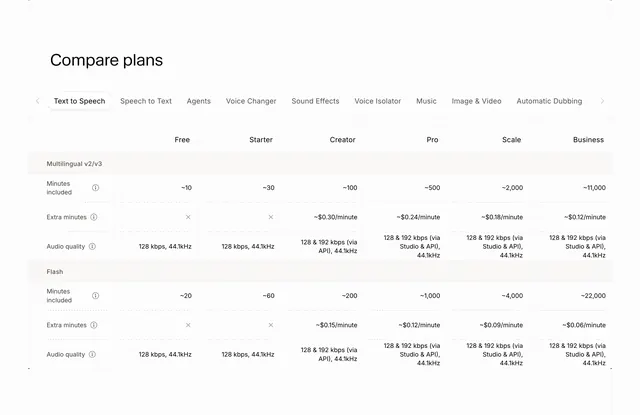 ElevenLabs compare plans table
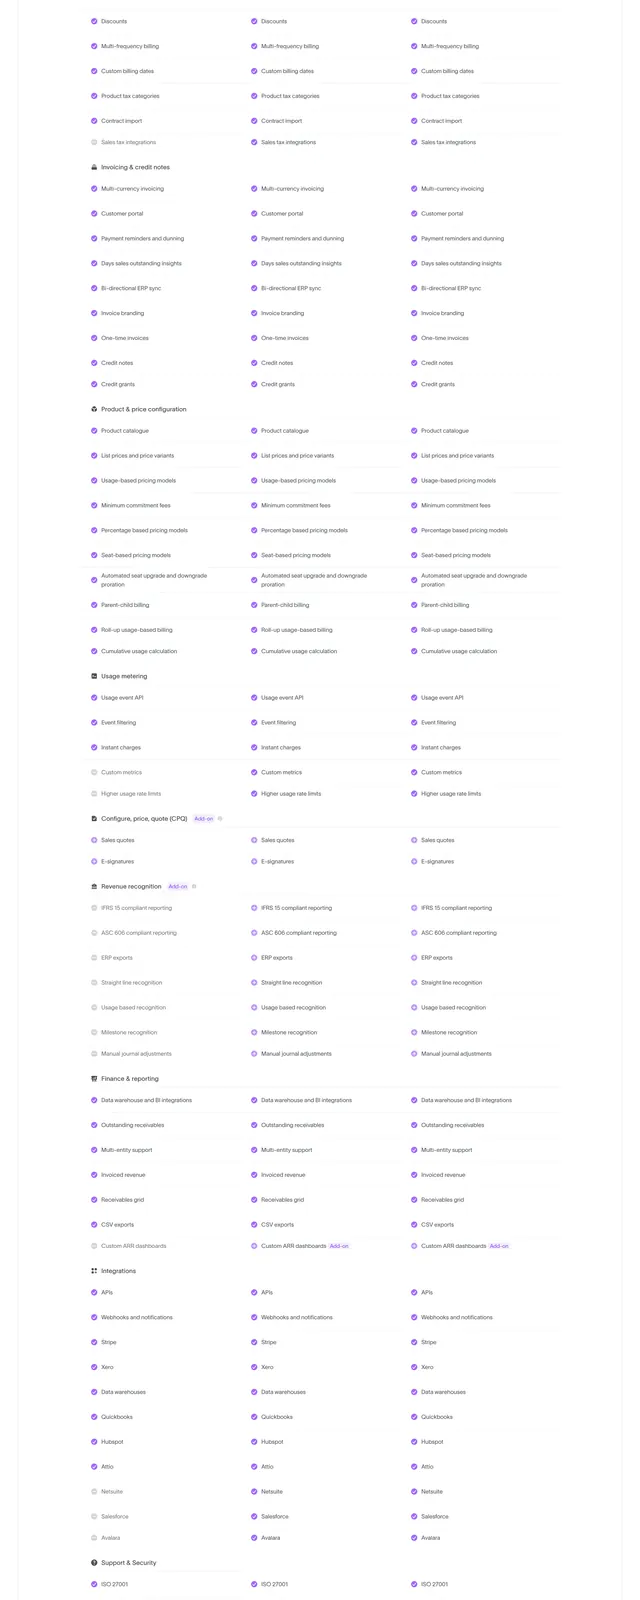 Sequence pricing plan comparison table
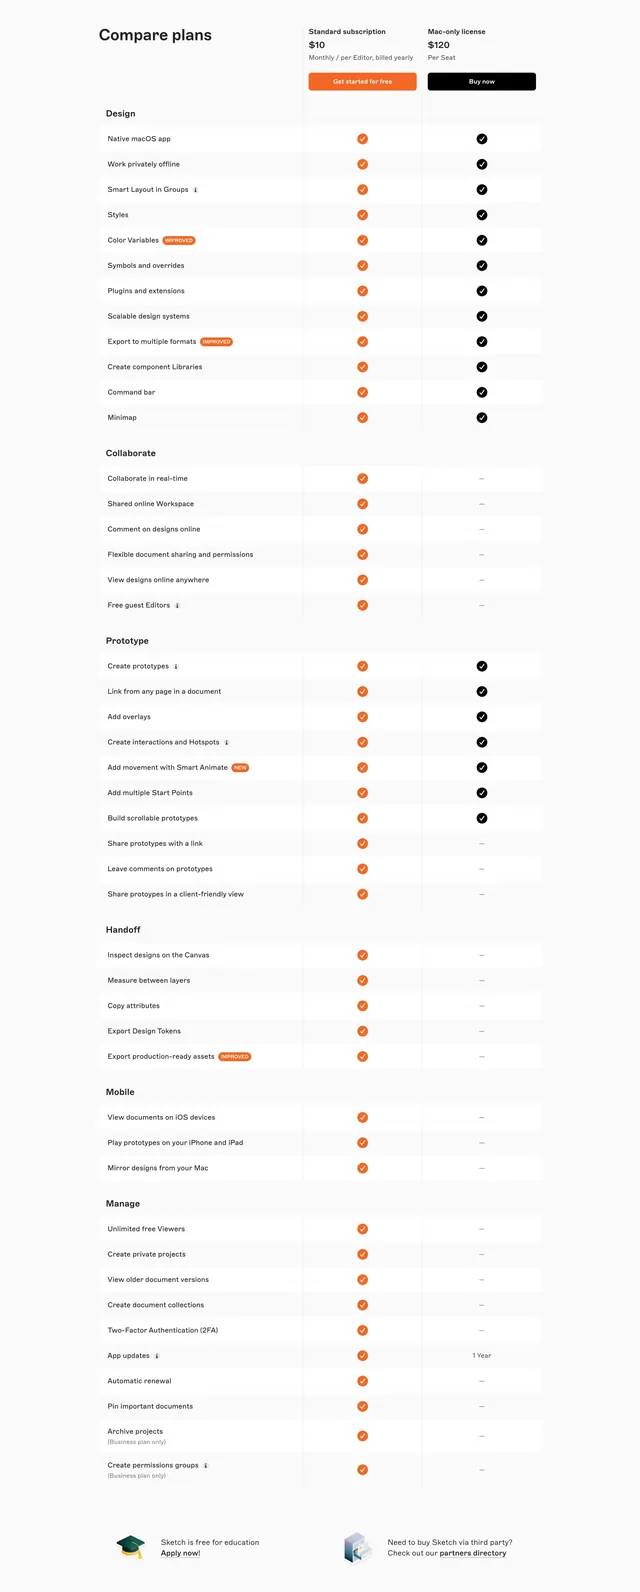 Sketch compare plans feature table
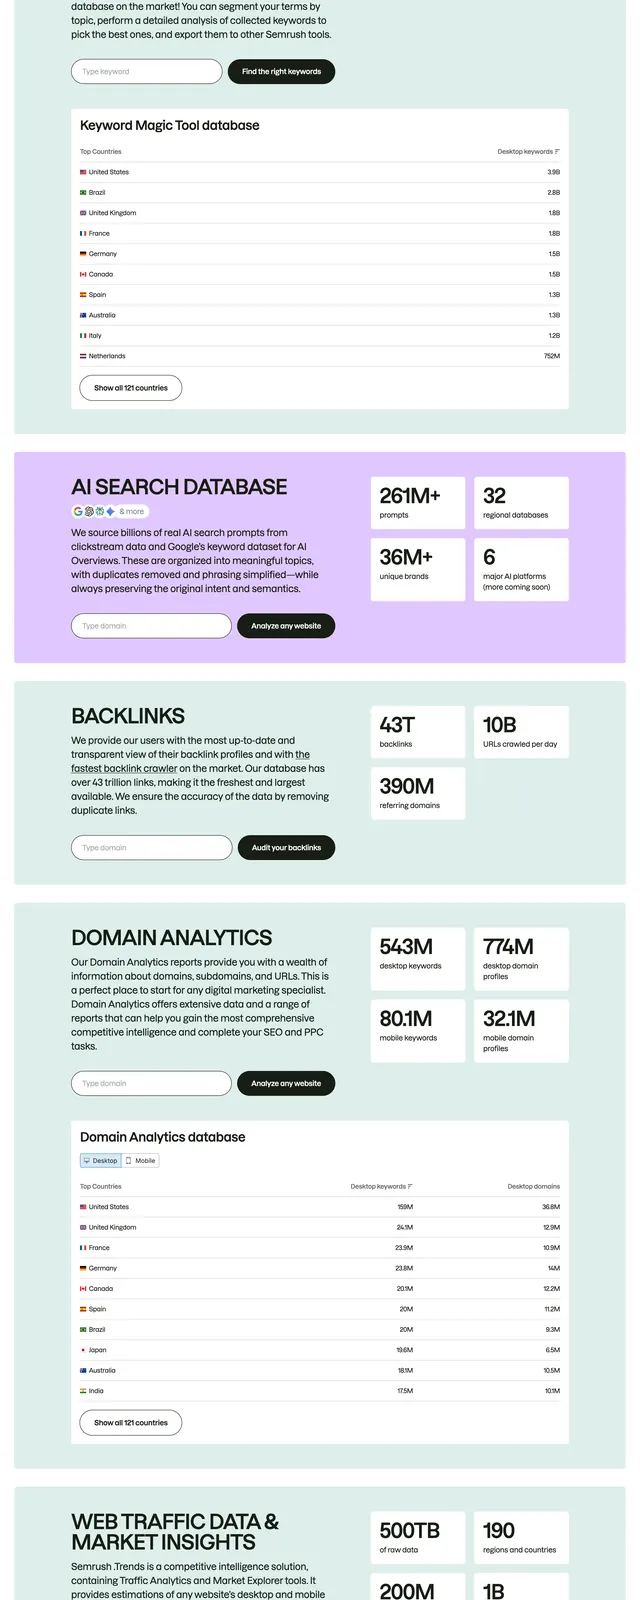 Semrush stacked data feature blocks
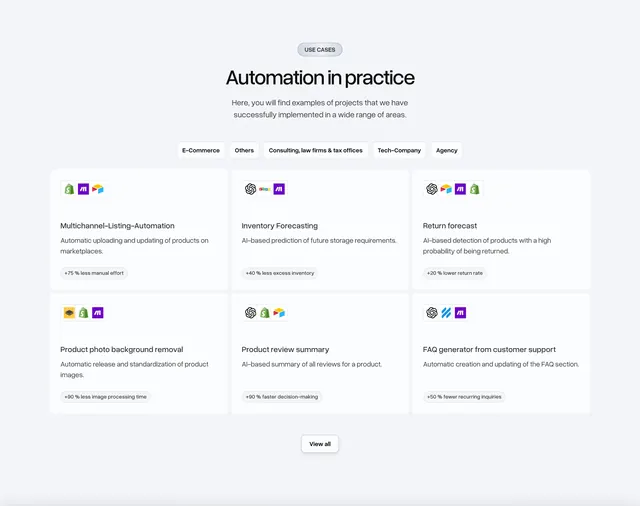 Bakedwith automation use cases grid
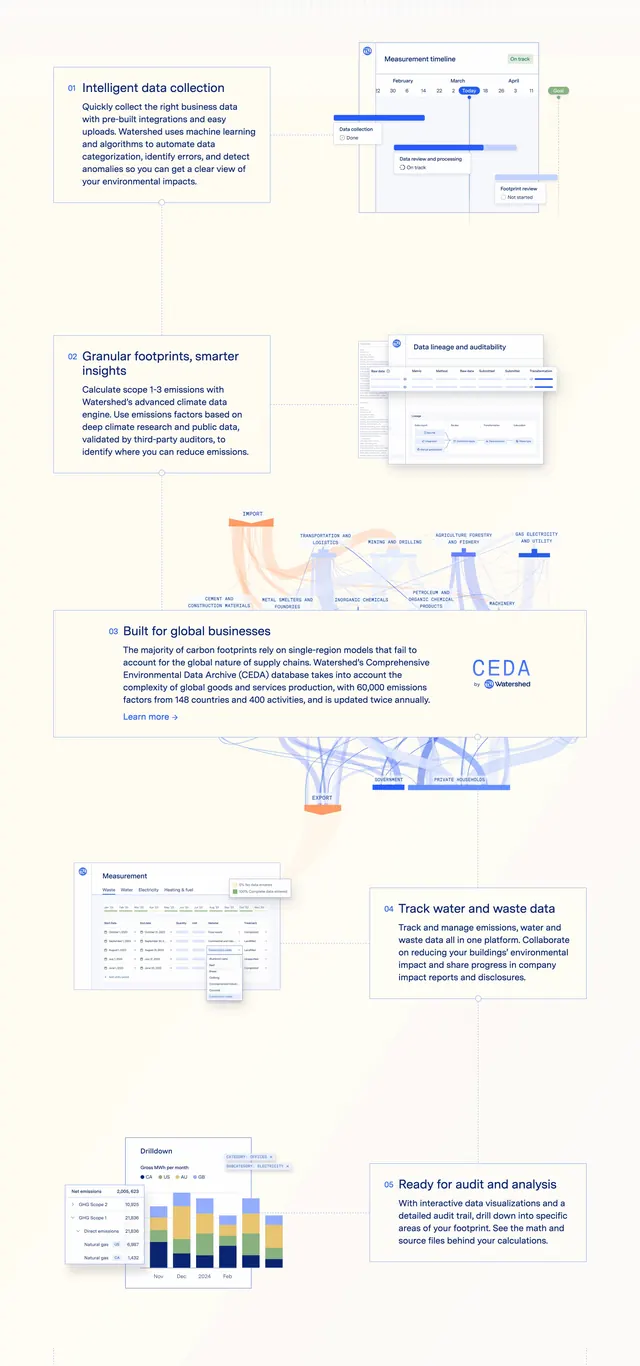 Watershed Measure Page Section Features
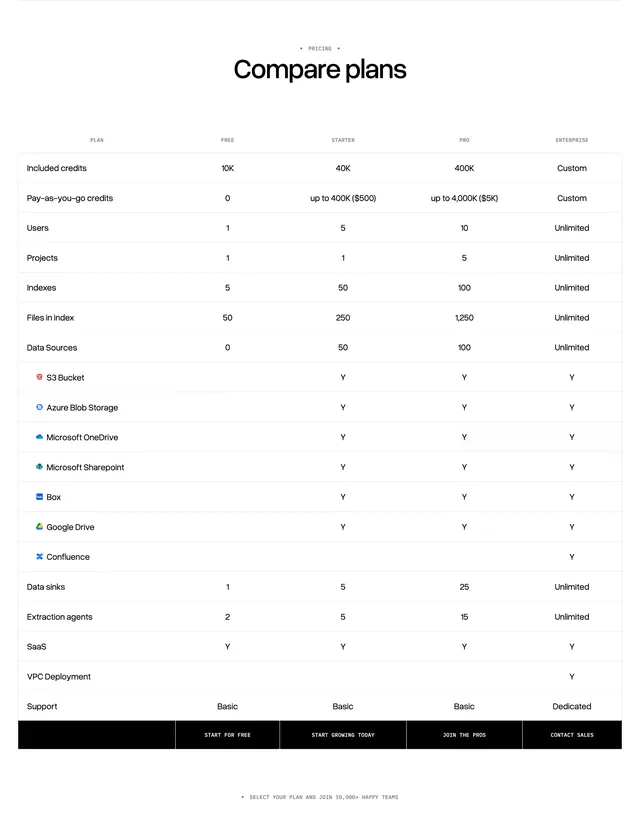 LlamaCloud plan comparison table
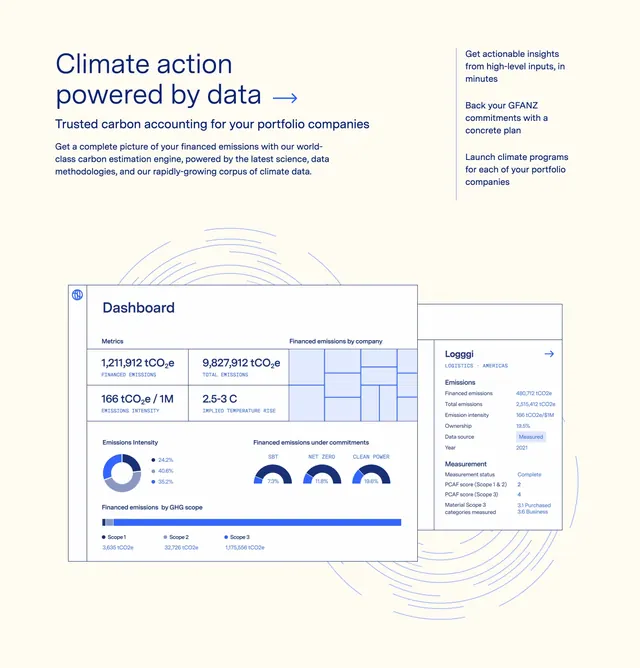 Watershed Solutions Page Section Trusted Carbon Accounting
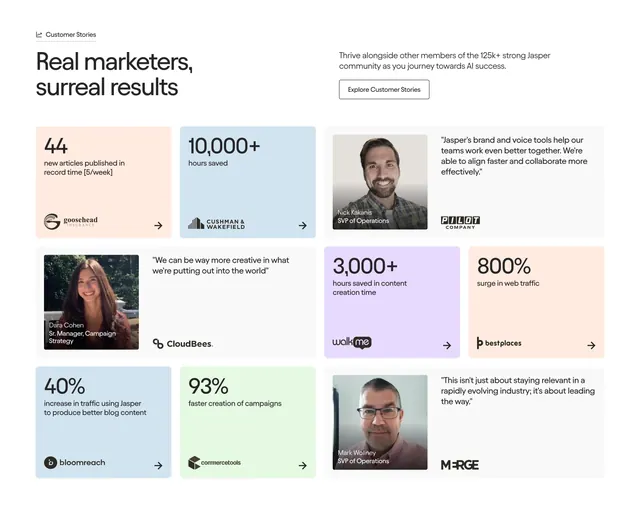 Jasper bento testimonials mixing stats and quotes
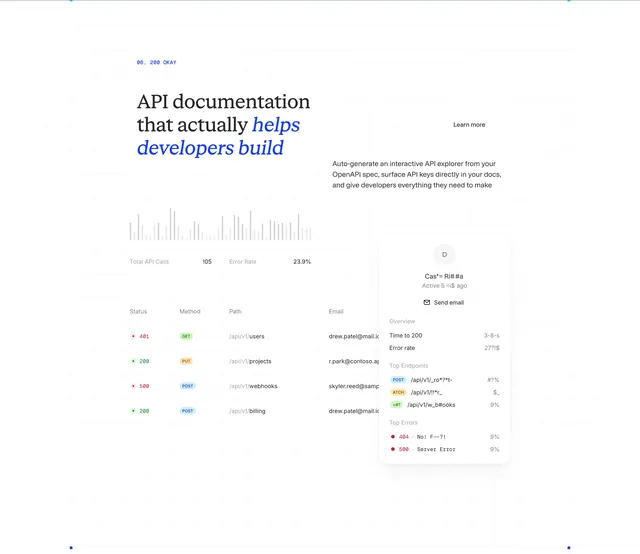 ReadMe API docs analytics bento feature
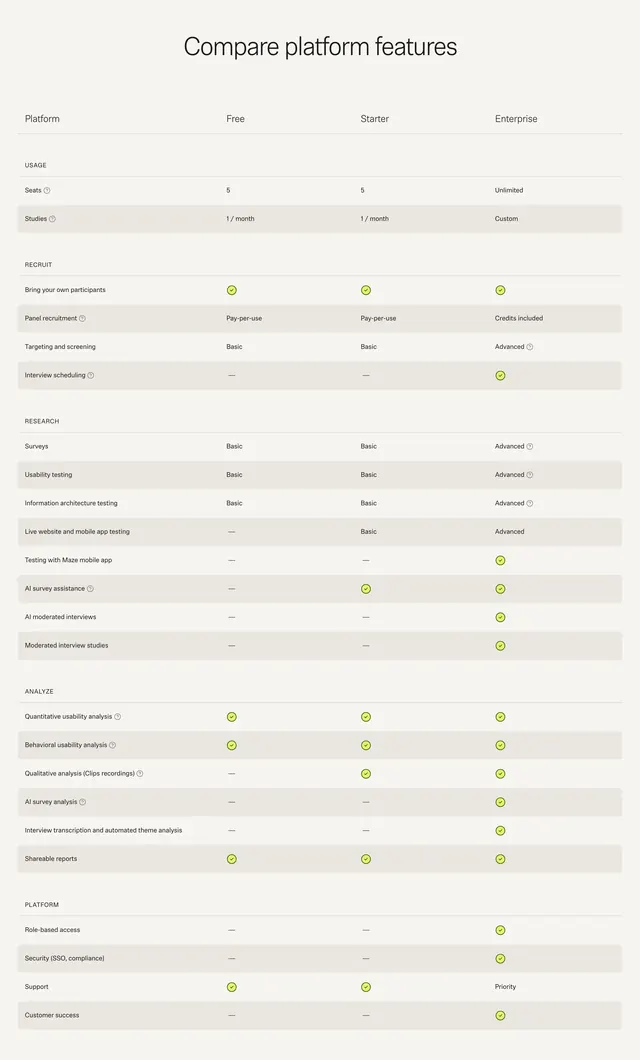 Maze platform feature comparison table
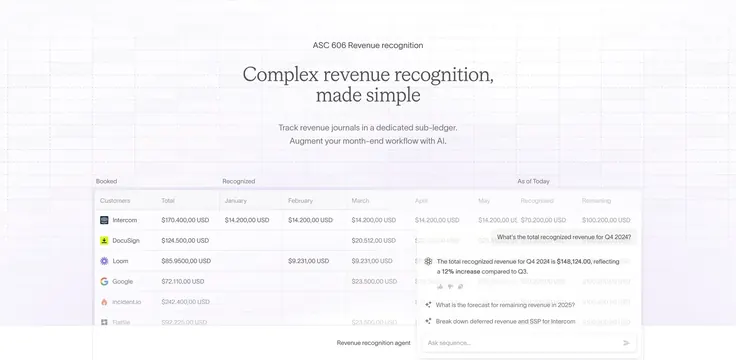 Sequence ASC 606 revenue table with AI agent overlay
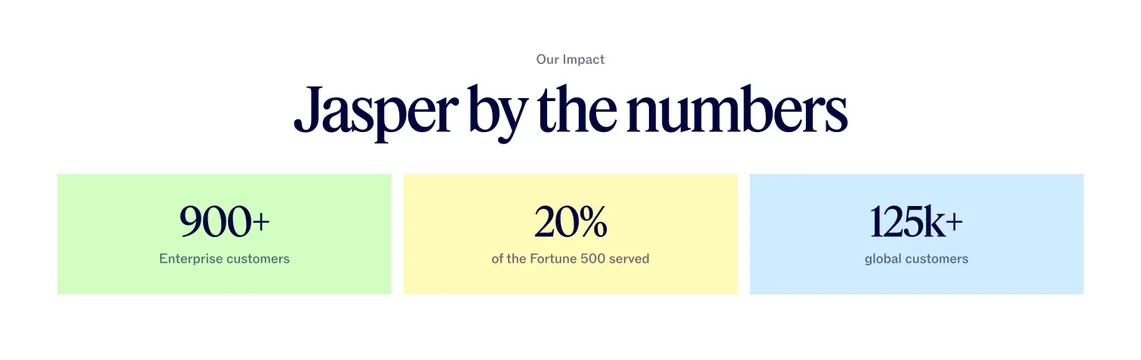 Jasper "by the numbers" three pastel stat blocks
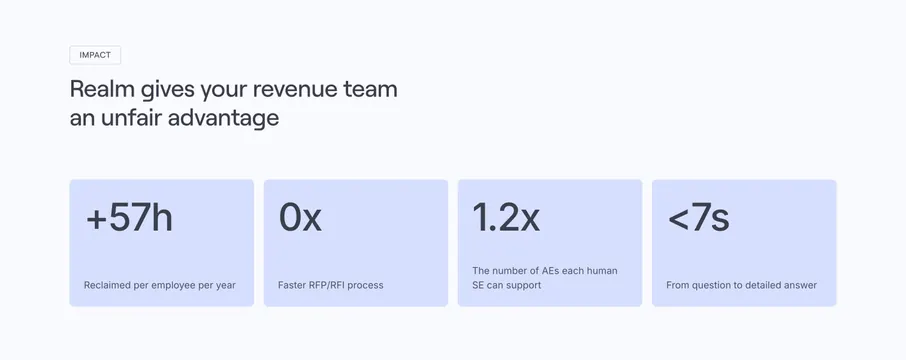 Realm Value Proposition Section
 HubSpot platform hubs grid
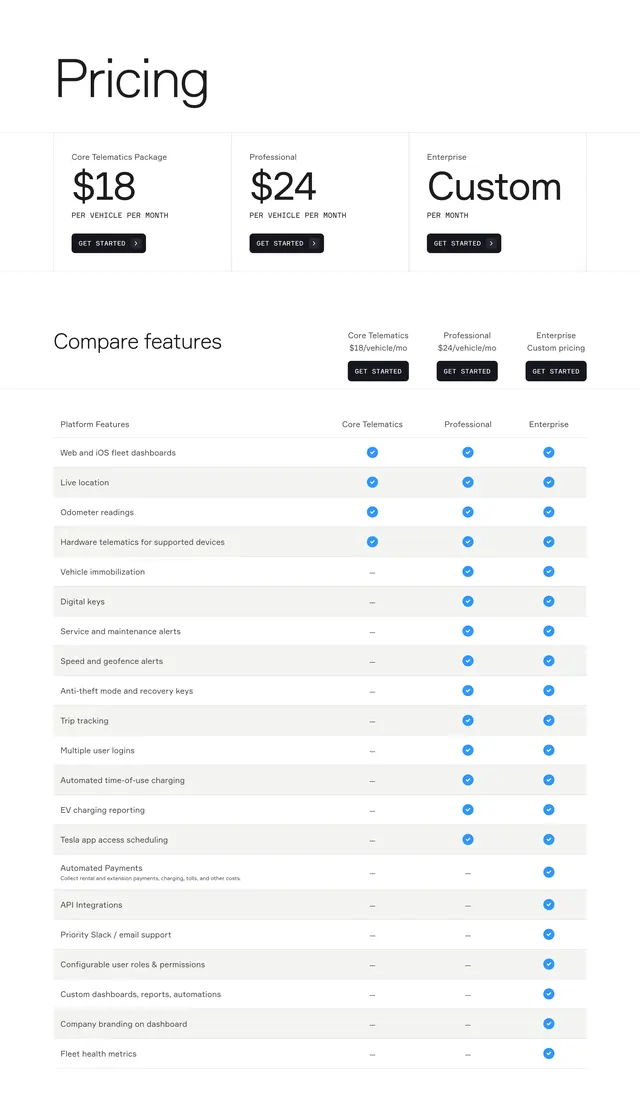 Standard Fleet telematics pricing comparison
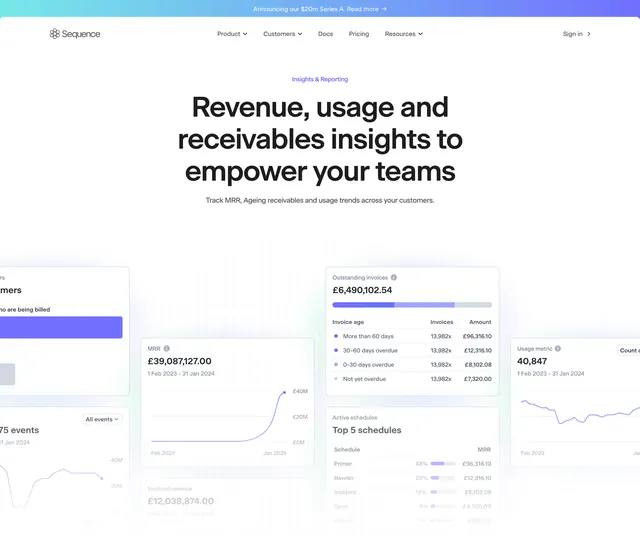 Sequence insights and reporting hero
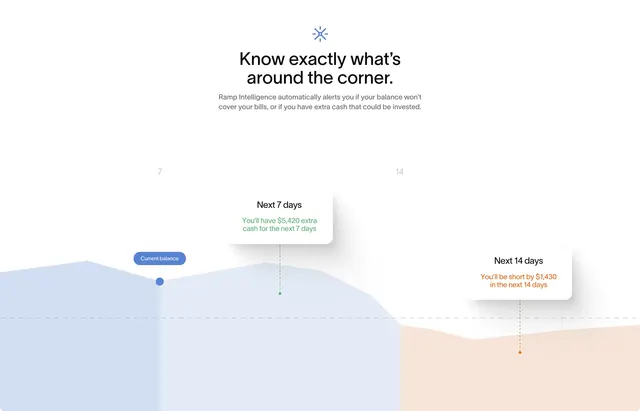 Ramp Intelligence cash flow forecast chart
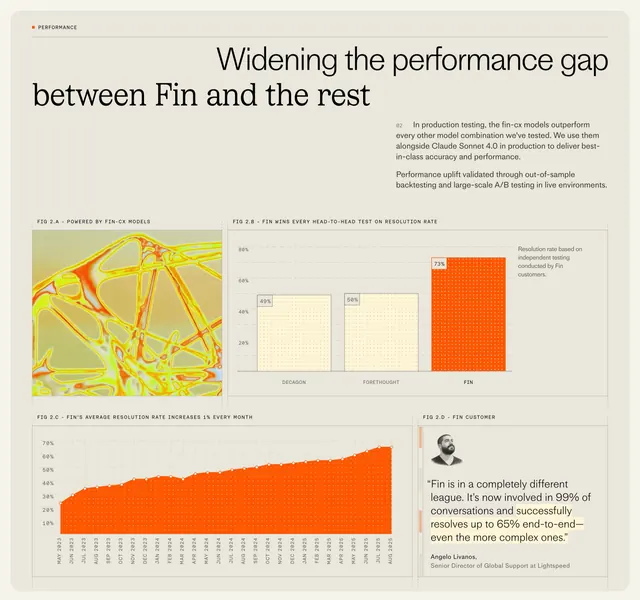 Fin CX model performance data grid
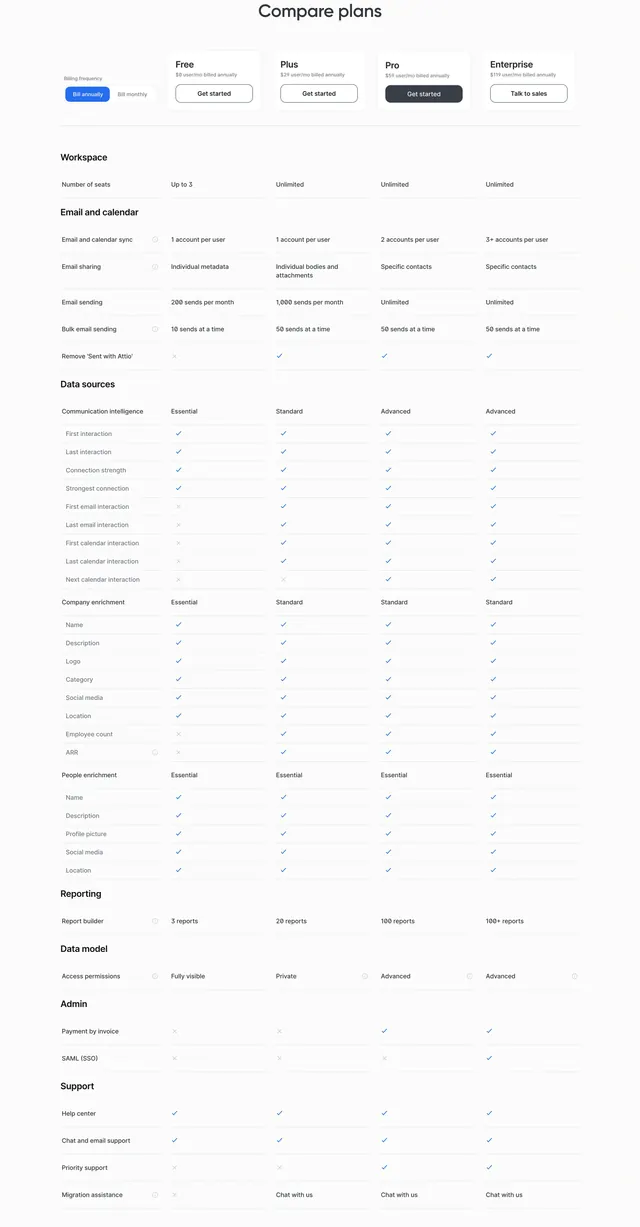 Attio compare plans pricing matrix
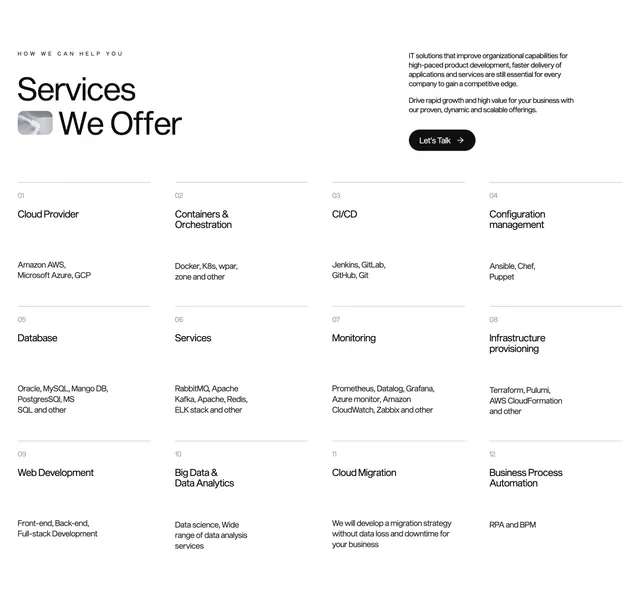 Xizt home page services
 Grove global metrics over halftone globe