RevenueBase process visualization explainer flow
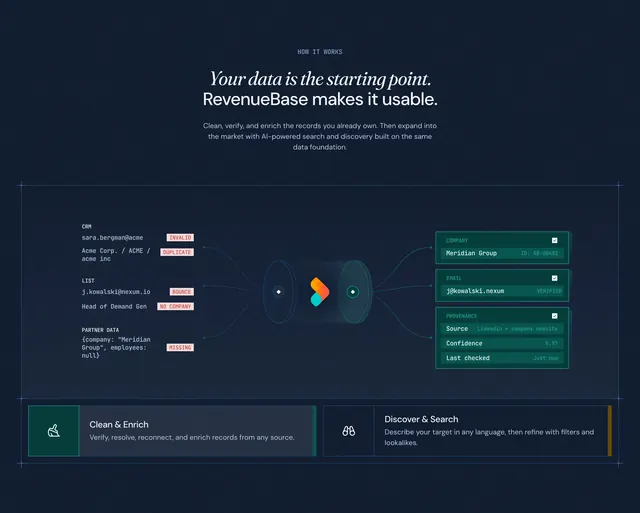
Dark how-it-works section with a horizontal messy-to-clean data pipeline diagram, error labels, and dual feature tabs below.
Summary
Dark how-it-works section with a horizontal messy-to-clean data pipeline diagram, error labels, and dual feature tabs below.
Visual description
Dark navy canvas framed by thin blueprint lines and corner crosshairs. HOW IT WORKS eyebrow above a split headline: Your data is the starting point. in serif italic and RevenueBase makes it usable. in sans-serif, with supporting copy about cleaning, verifying, and enriching existing records. Center stage is a left-to-right flow: three messy input stacks labeled CRM, LIST, and PARTNER DATA show red error pills (INVALID, DUPLICATE, BOUNCE, NO COMPANY, MISSING); teal connector lines feed a cylindrical processor with a colorful ribbon logo; outputs on the right are three green-tinted cards for COMPANY, EMAIL, and PROVENANCE with verified IDs and confidence metadata. Below, two wide tab panels sit side by side: active Clean & Enrich with broom icon on teal background, and inactive Discover & Search with binoculars icon and a gold accent edge.
Key takeaway
Showing literal bad records on the left and structured output cards on the right makes abstract enrichment tangible. Red error chips and green result cards create instant before/after contrast without a paragraph of explanation. Dual tabs below extend the story into a second product mode without leaving the section.
Reuse notes
Strong for data quality, ETL, or enrichment products where prospects need to see the transformation. Keep input examples realistic and label errors clearly. The horizontal pipeline needs width; stacked mobile layouts should preserve input-to-output reading order.
More like this
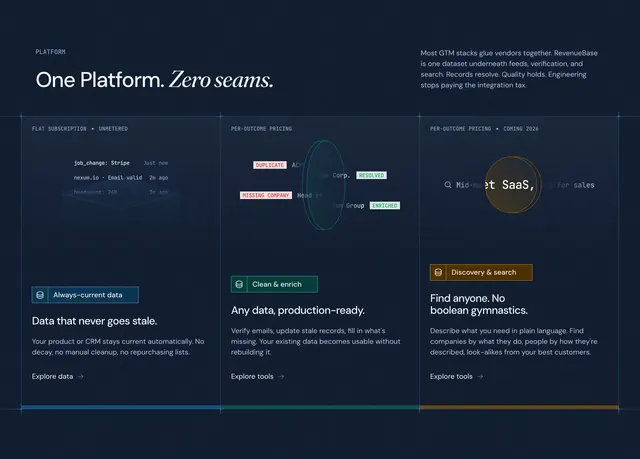 RevenueBase platform capabilities feature showcase
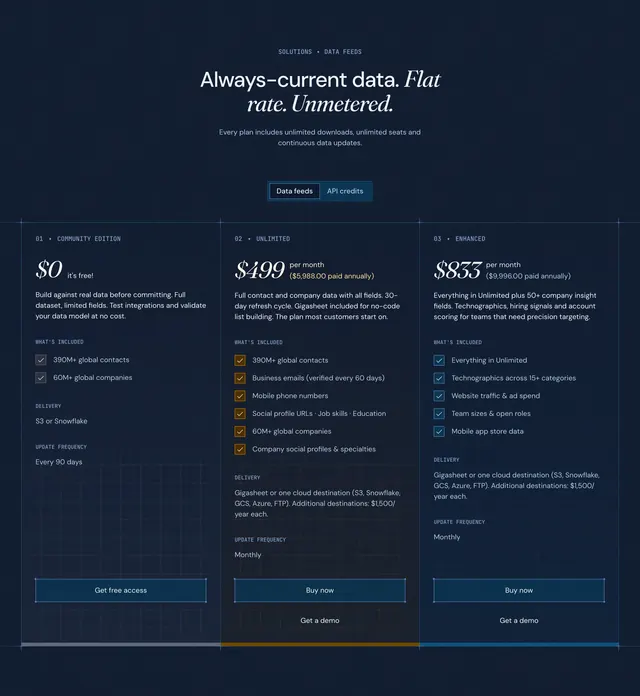 RevenueBase pricing tiers comparison table
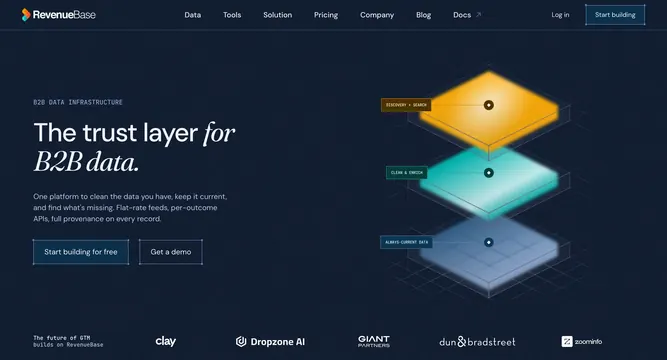 RevenueBase B2B data infrastructure hero
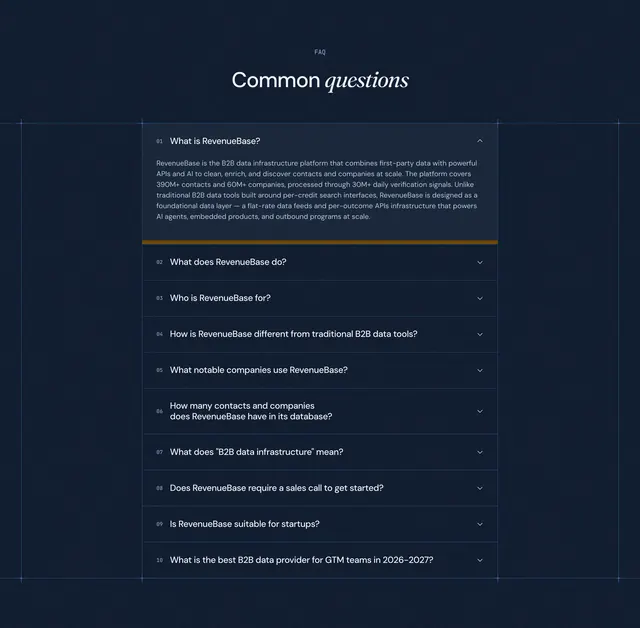 RevenueBase numbered FAQ accordion
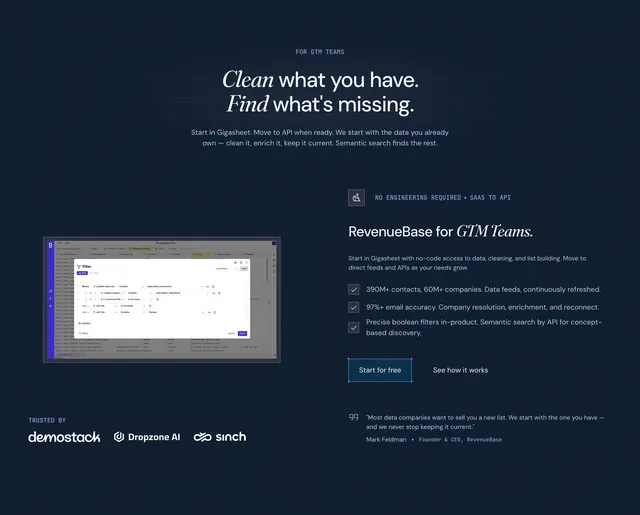 RevenueBase GTM teams value proposition
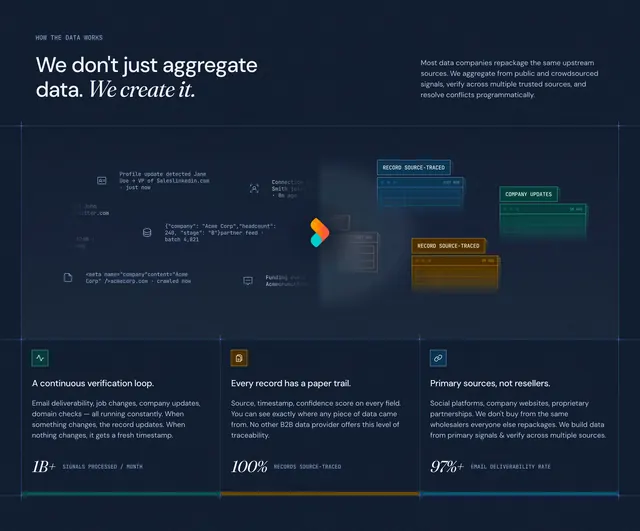 RevenueBase how-the-data-works value section
 RevenueBase value proposition CTA banner
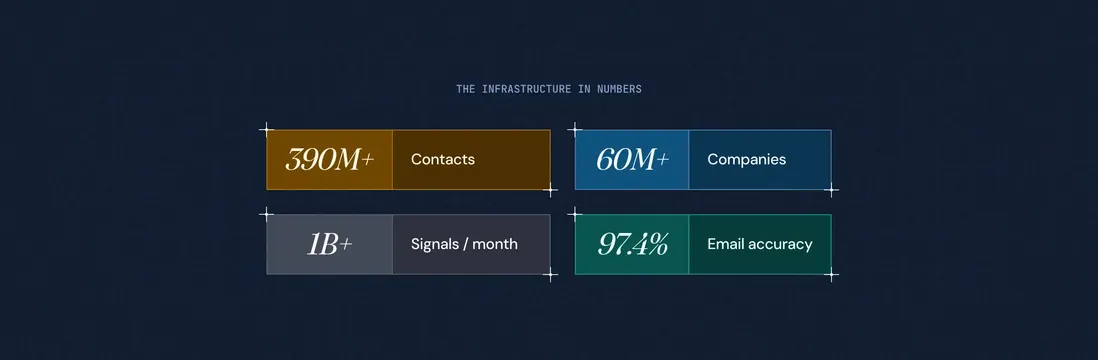 RevenueBase color-coded metrics grid
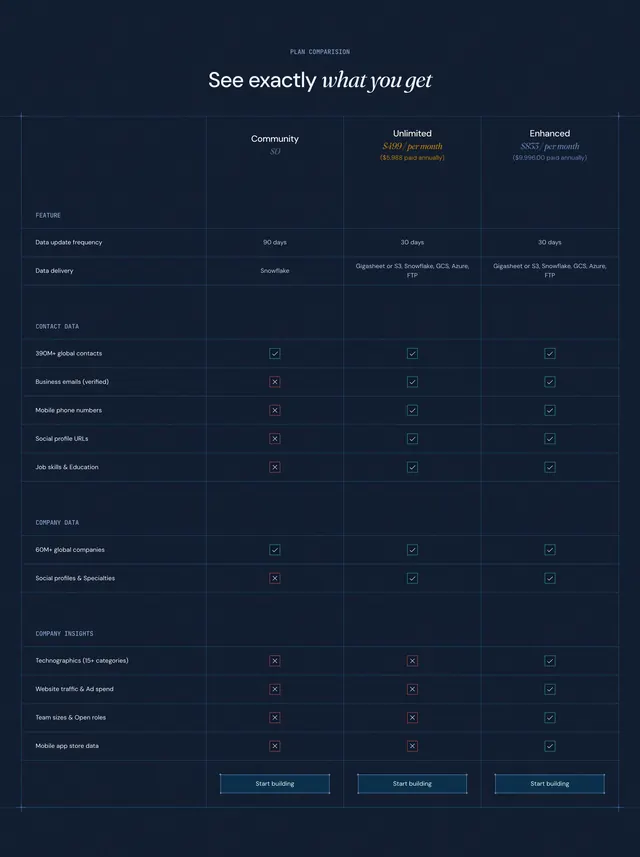 RevenueBase plan comparison feature table
 GitHub homepage productivity section
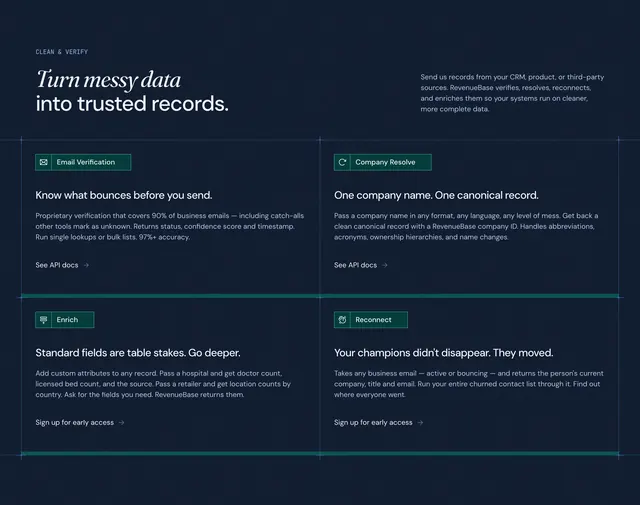 RevenueBase clean-and-verify feature grid
 AuthKit extensibility architecture diagram
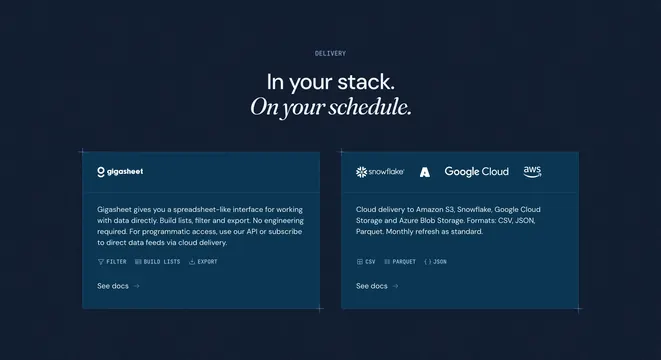 RevenueBase data delivery integration options
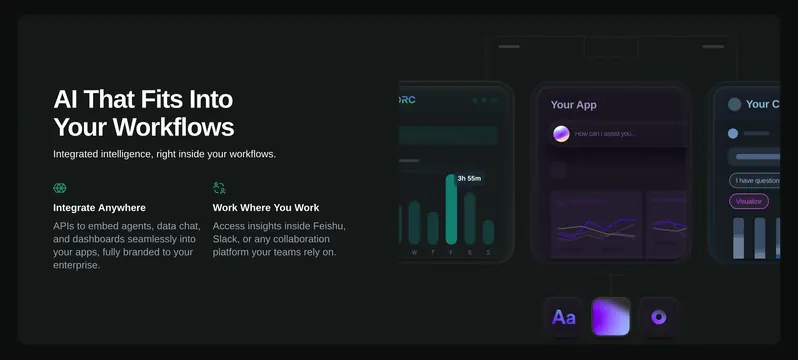 ReOrc AI workflow integration feature
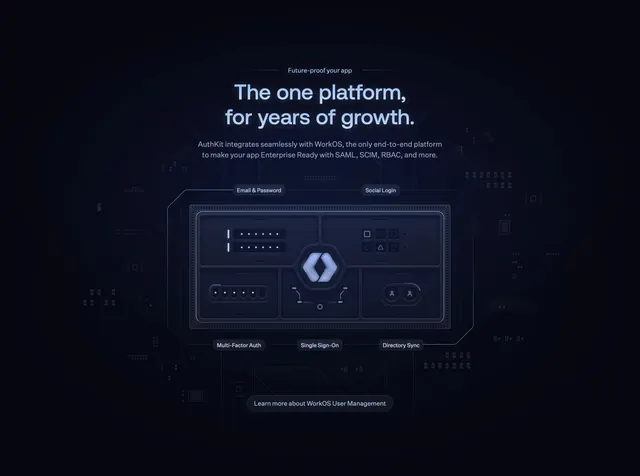 AuthKit WorkOS enterprise growth platform
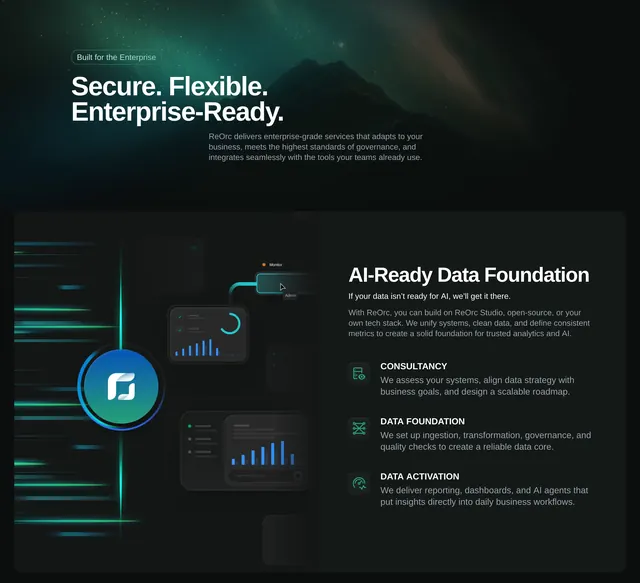 ReOrc enterprise data foundation feature
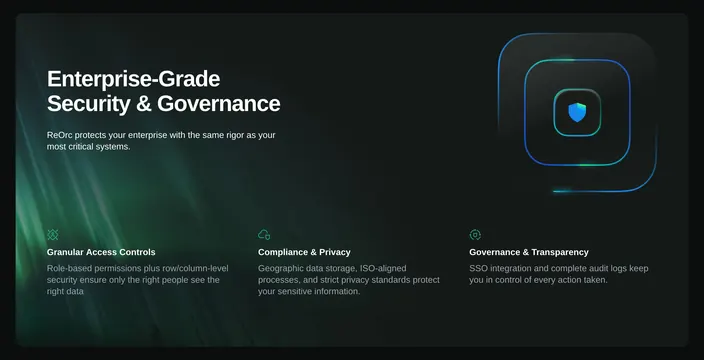 ReOrc security governance feature grid
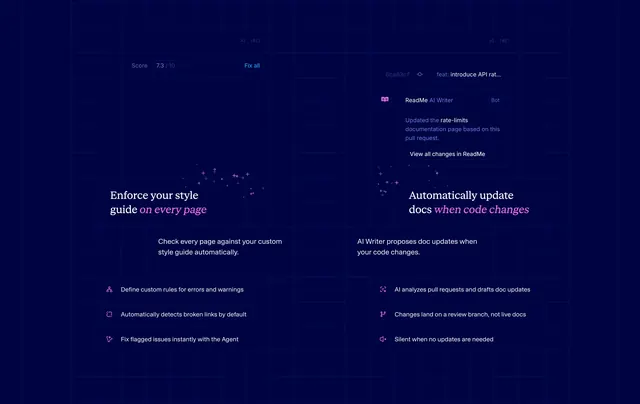 ReadMe AI style guide and writer grid
 RevenueBase dark footer sitemap
 RevenueBase team directory grid
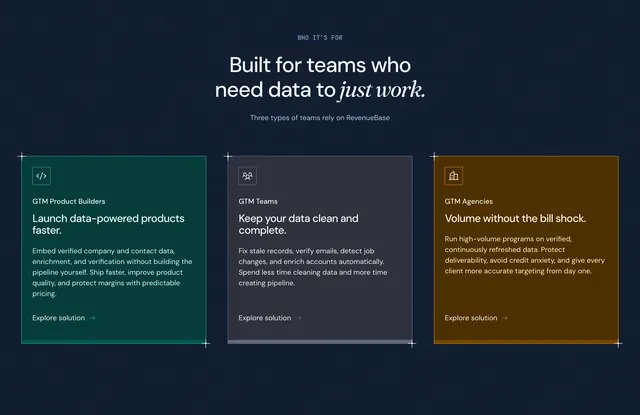 RevenueBase target users audience segmentation
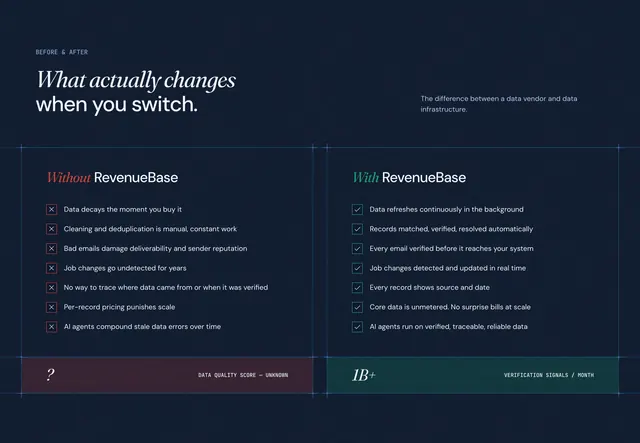 RevenueBase before-and-after comparison matrix
 GitHub Advanced Security hero
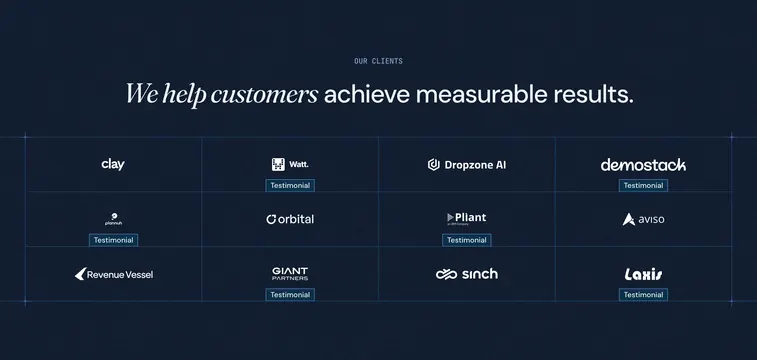 RevenueBase blueprint client logo grid