Incident four-tier plan comparison table
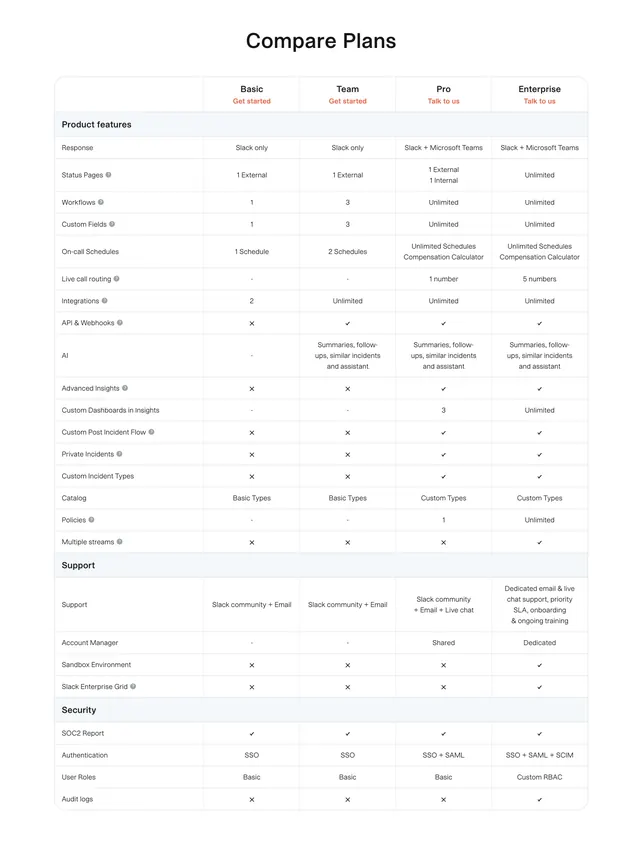
Light four-column feature comparison table grouping rows into Product features, Support, and Security with shaded section headers.
Summary
A clean, light feature-comparison table laying four plan tiers (Basic, Team, Pro, Enterprise) side by side, with the row list segmented into labeled groups so a long matrix stays scannable.
Visual description
A centered "Compare Plans" headline in bold black sits above a bordered table. The header row names four tiers, each with a small orange call-to-action label ("Get started" or "Talk to us"). Rows are divided into shaded full-width group bands ("Product features", "Support", "Security") that break up the long list. Cells hold short text values, checkmarks for included items, and a cross or dash for excluded ones. Several row labels carry small info tooltip icons. Everything is near-monochrome on white, with orange used only for the per-column CTAs.
Key takeaway
The shaded full-width group-header bands that chunk a 30-plus-row comparison into digestible sections without adding clutter. Pairing each column header with its own small CTA so the buy action travels with the plan name.
Reuse notes
Strong default for a SaaS pricing or plan-comparison page with many features across tiers. Best when you have genuinely long feature lists that need grouping; for three or fewer short tiers a card layout reads better. The restrained single accent color keeps a dense table calm.
More like this
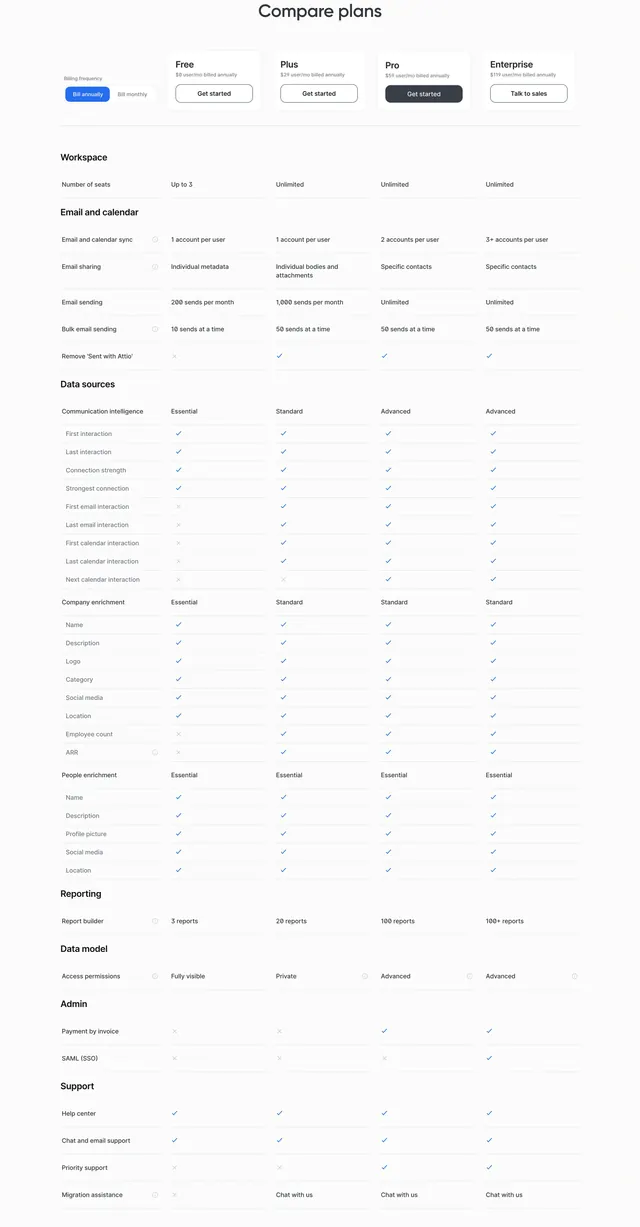 Attio compare plans pricing matrix
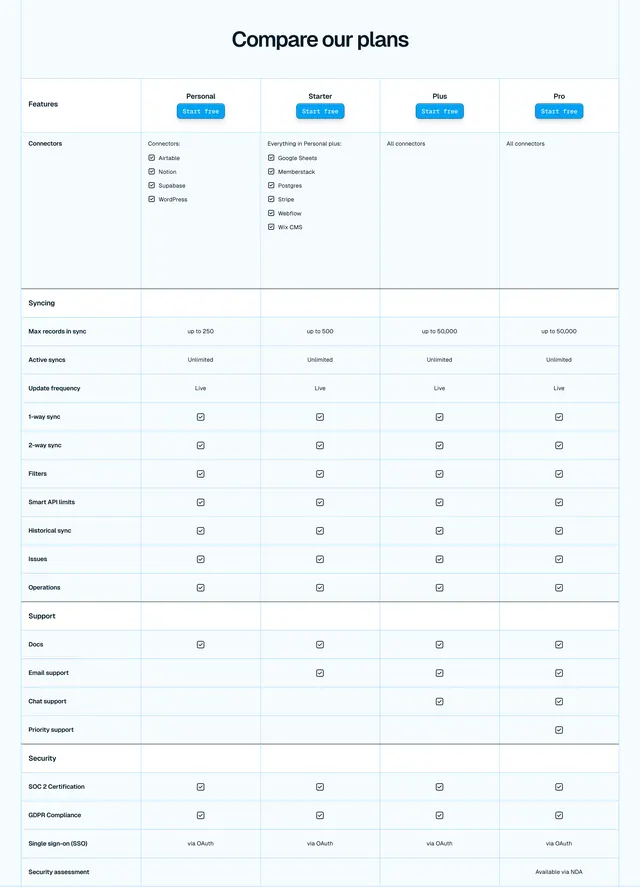 Whalesync four-column feature comparison table
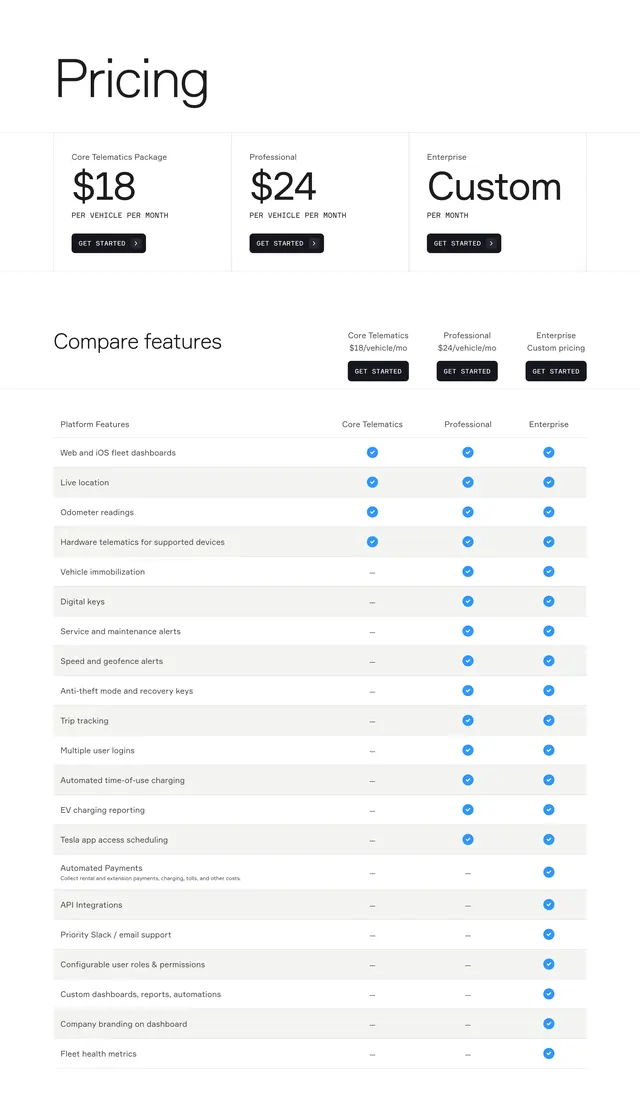 Standard Fleet telematics pricing comparison
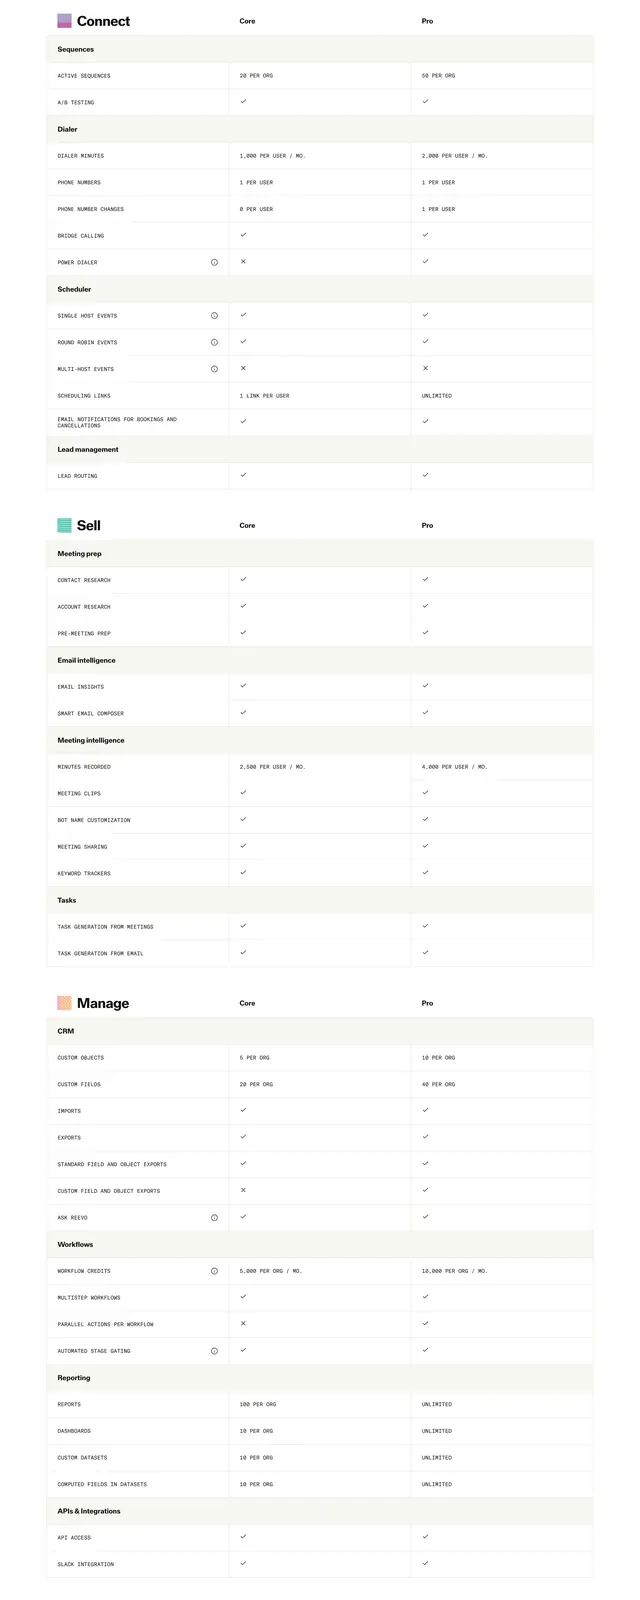 Reevo Core vs Pro comparison table
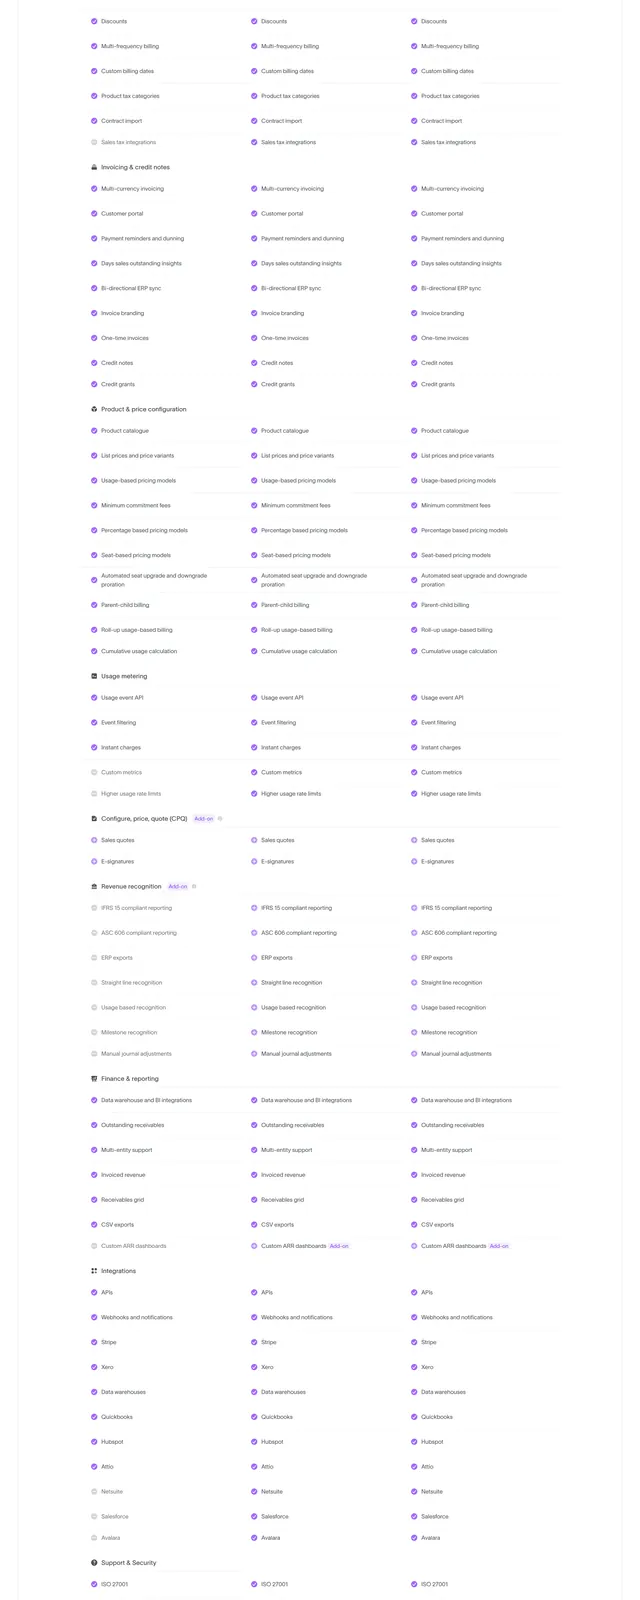 Sequence pricing plan comparison table
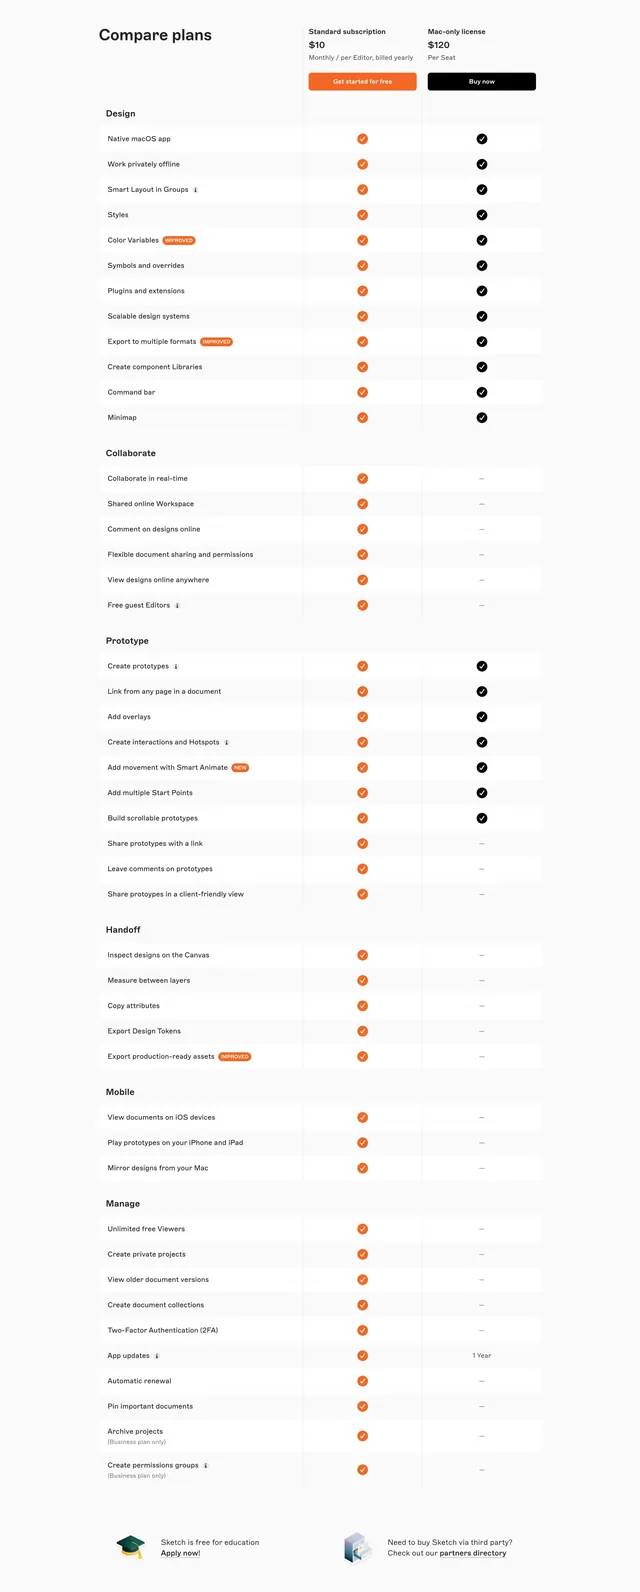 Sketch compare plans feature table
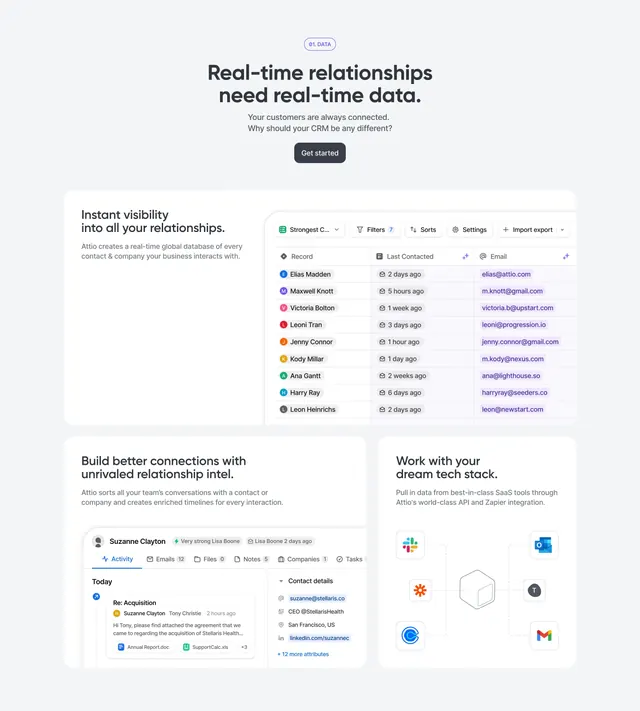 Attio Data bento with table and integrations
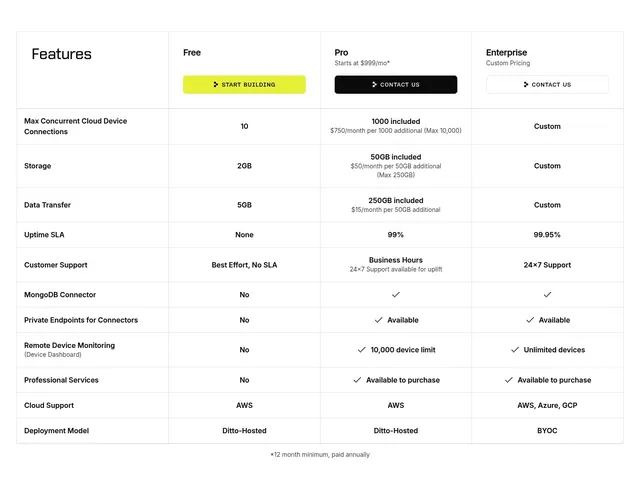 Ditto detailed plan comparison table
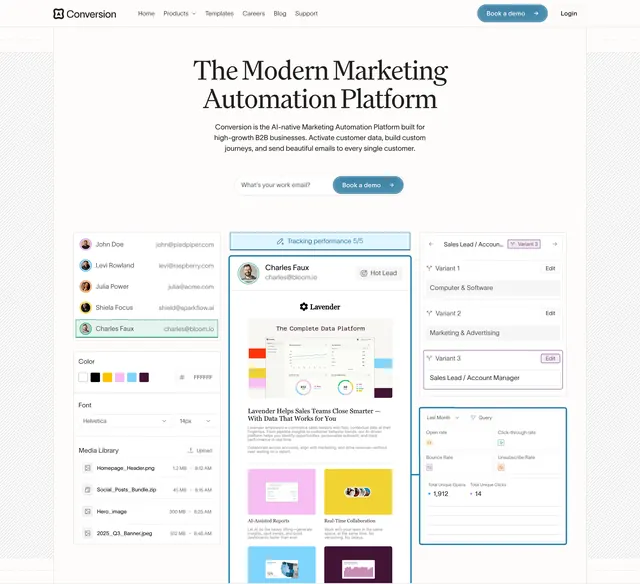 Conversion platform dashboard hero
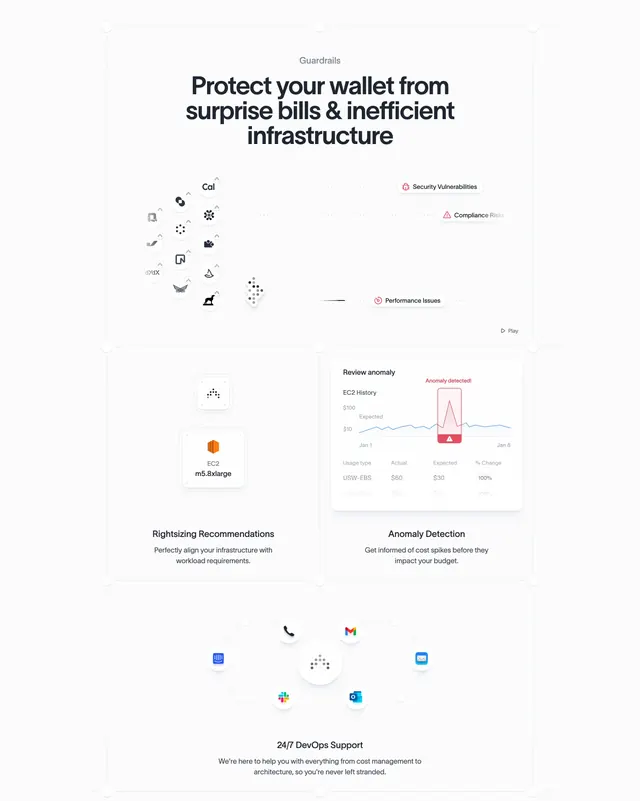 Antimetal guardrails feature section
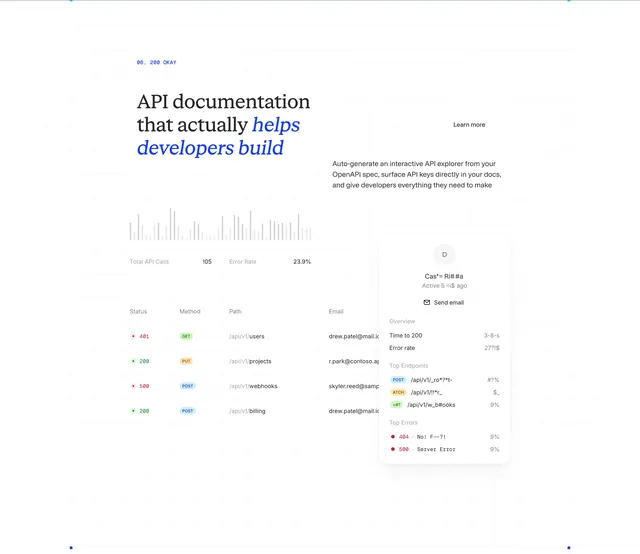 ReadMe API docs analytics bento feature
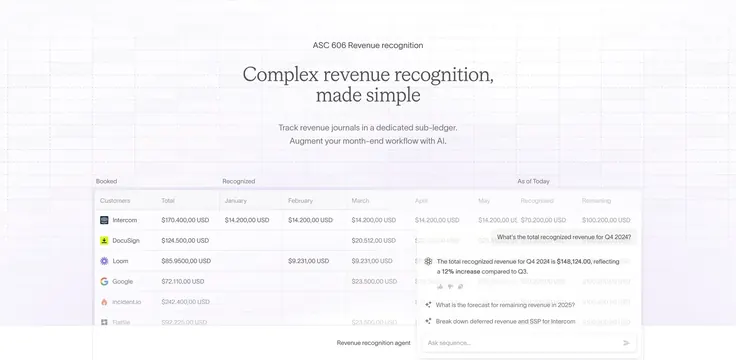 Sequence ASC 606 revenue table with AI agent overlay
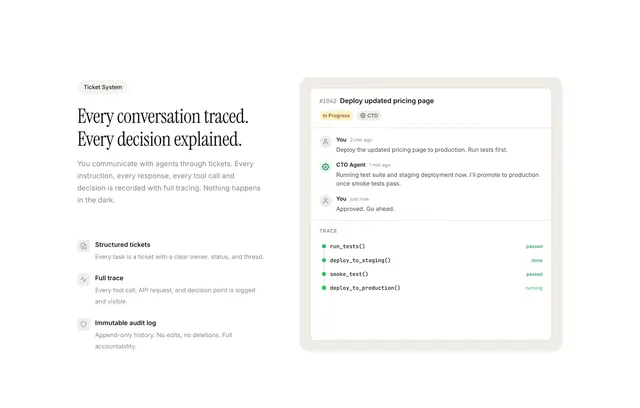 Paperclip agent tracing ticket feature
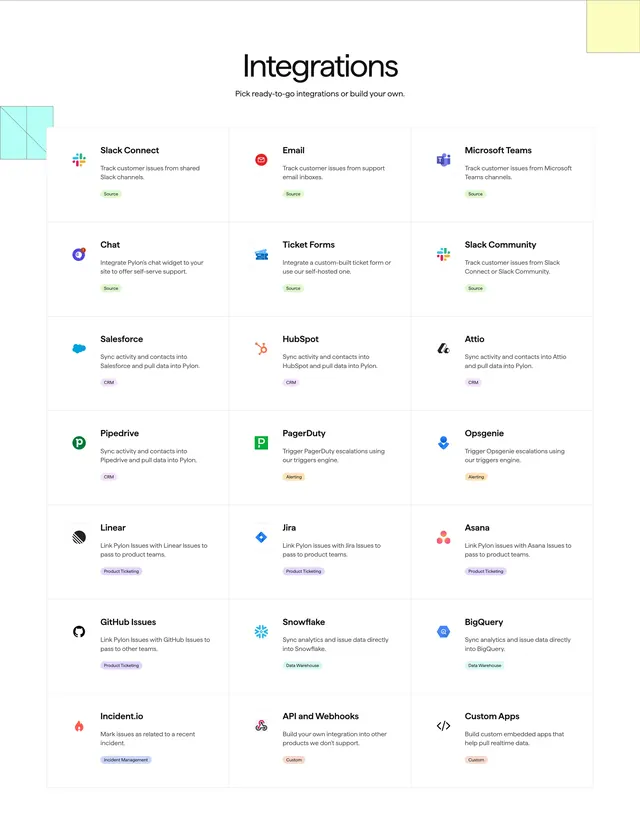 Pylon integrations grid
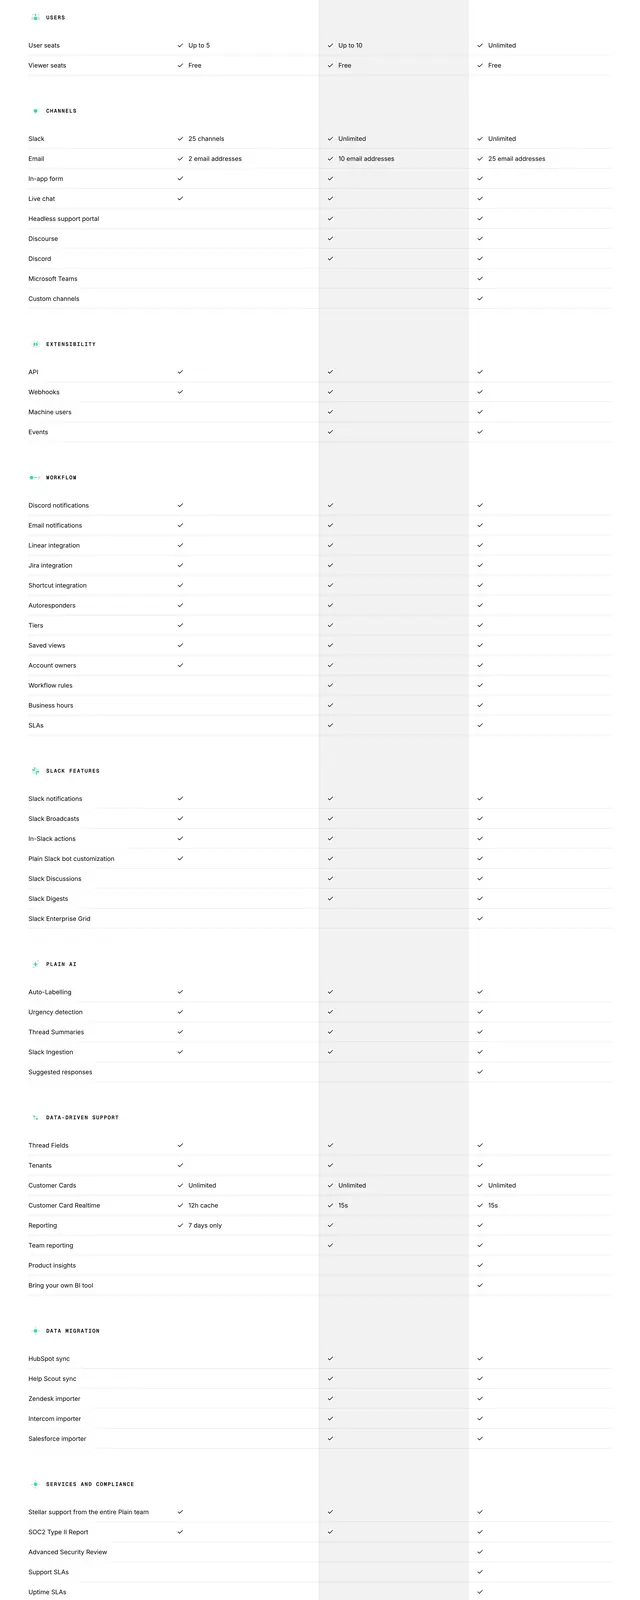 Plain Launch Grow Scale comparison table
 Antimetal visibility dashboard feature
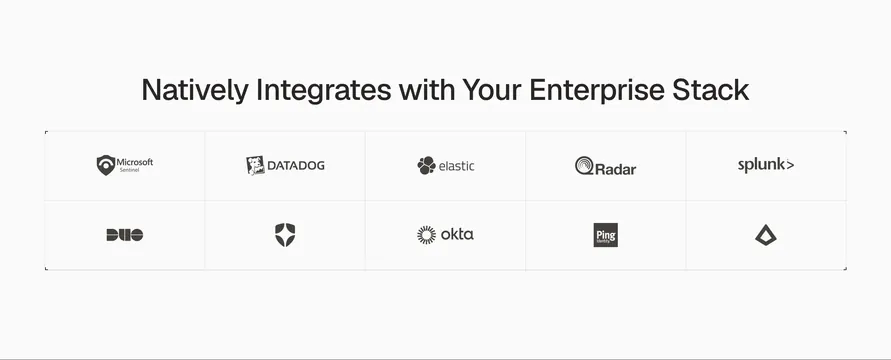 Runlayer enterprise integrations logo grid
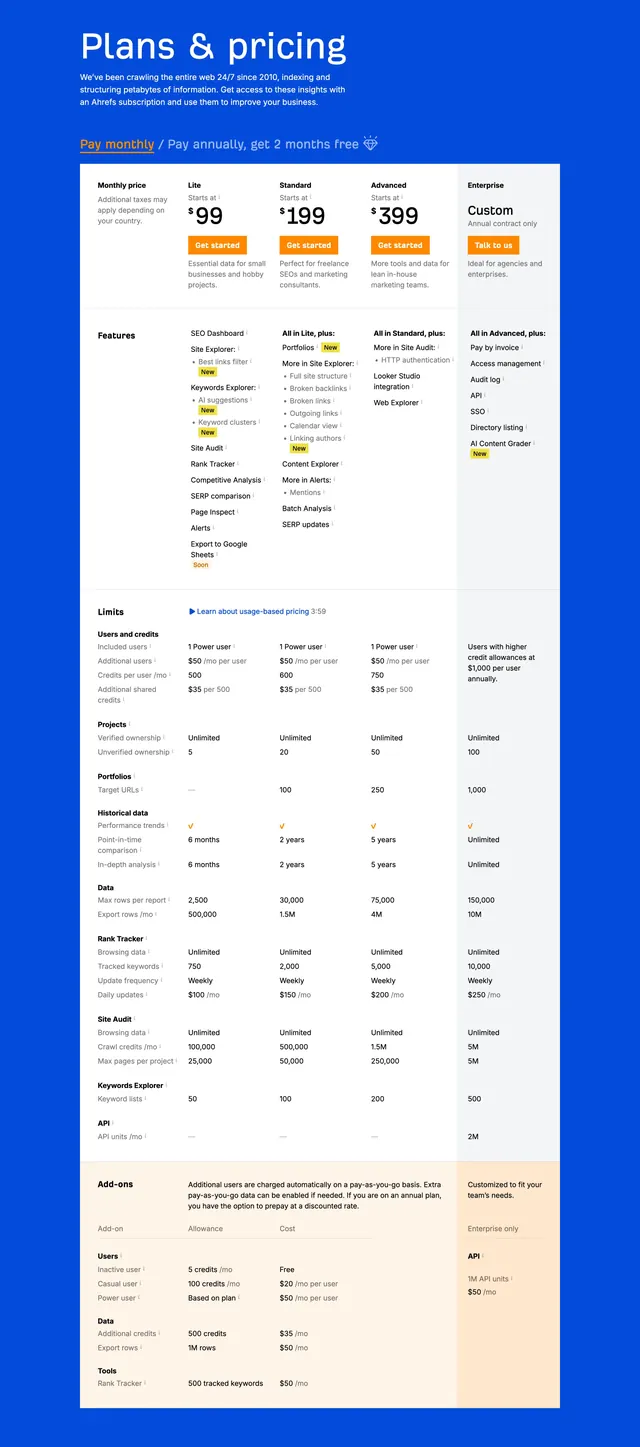 Ahrefs plans and pricing comparison table
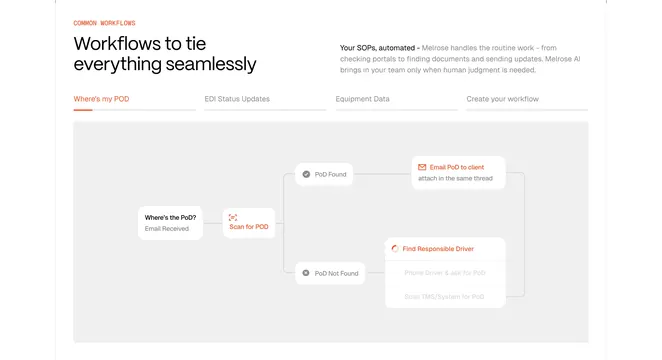 Melrose common workflows diagram
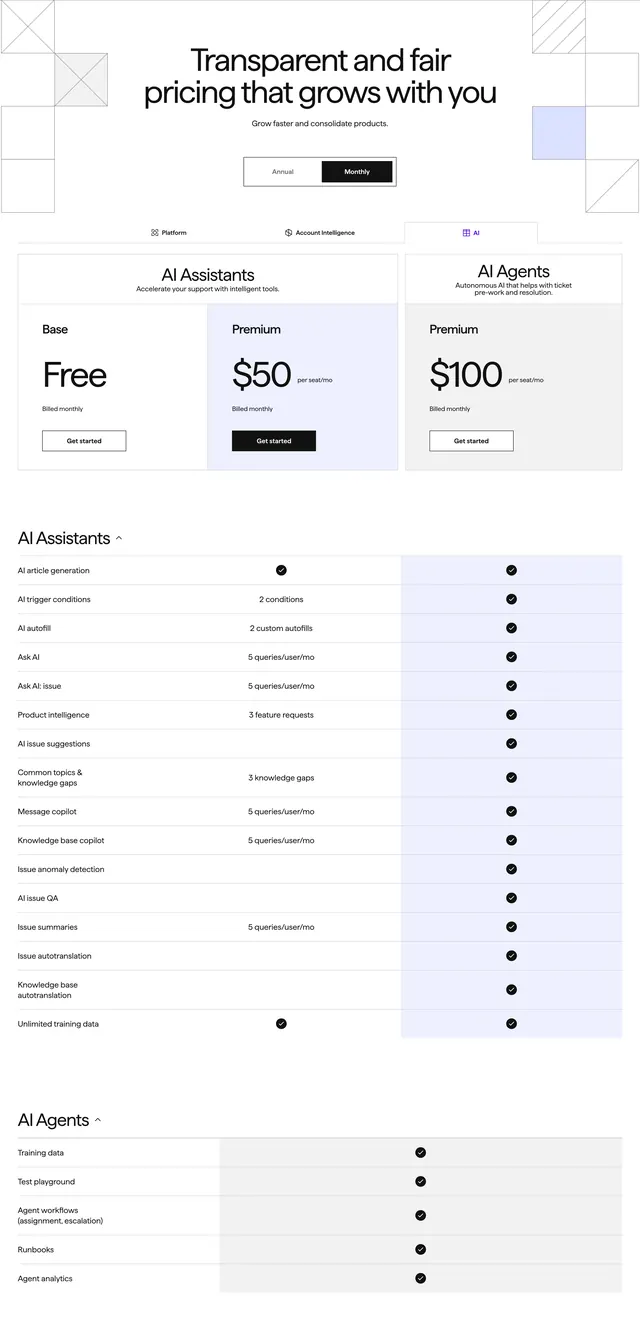 Pylon AI subscription pricing table
 Ahrefs content and keyword index statistics
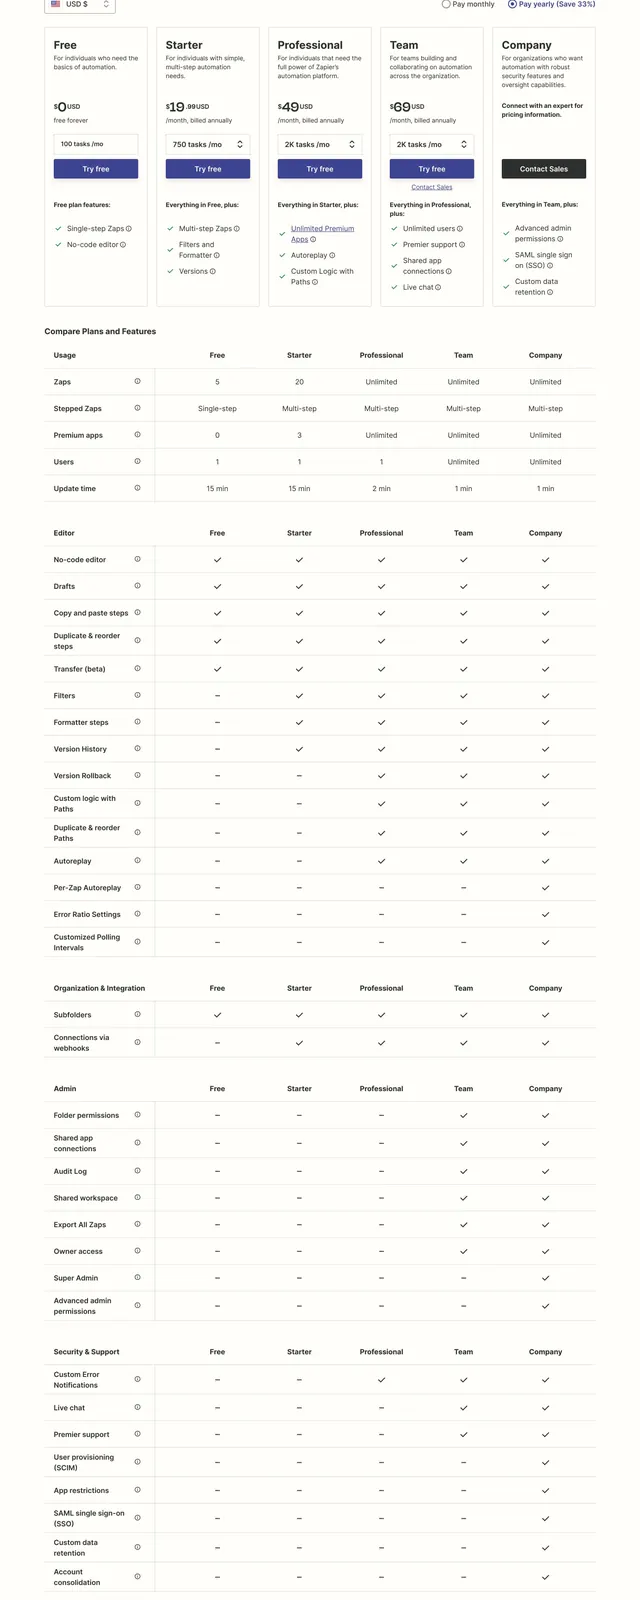 Zapier pricing page pricing table
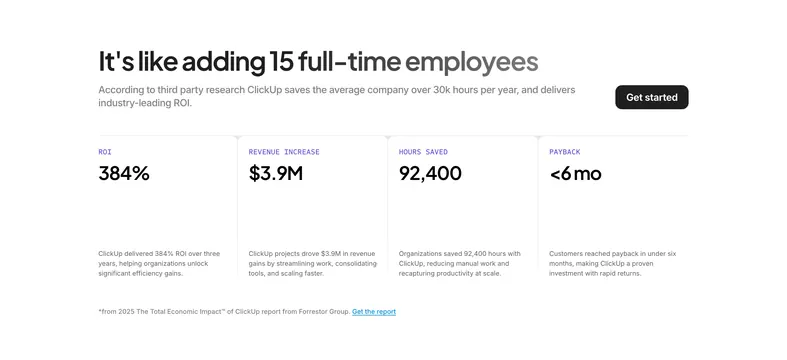 ClickUp Forrester ROI statistics grid
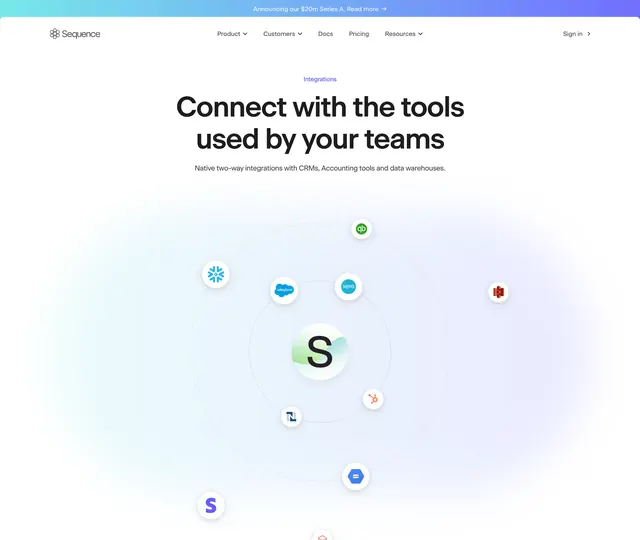 Sequence integrations hero with orbital logo map