Ahrefs infrastructure big-data statistics
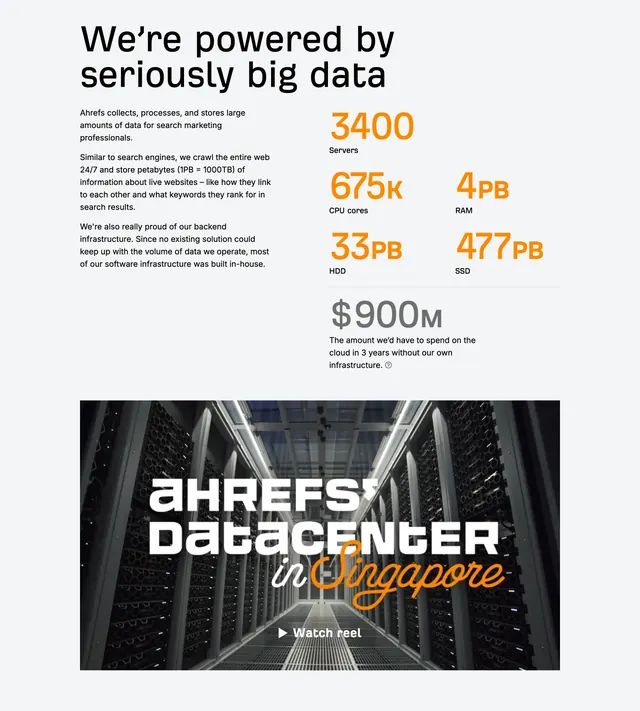
Two-column copy and orange infrastructure stats over a full-bleed datacenter photo with a visible video play CTA.
Summary
An infrastructure credibility section that pairs narrative copy and a grid of hardware stats with a cinematic datacenter image and an on-screen "Watch reel" video prompt.
Visual description
Top half on light gray: left column has headline "We're powered by seriously big data" and three paragraphs on crawling volume and self-hosted infrastructure. Right column is a compact grid of five orange numerals with small black labels (3400 Servers, 675K CPU cores, 4PB RAM, 33PB HDD, 477PB SSD), then a larger dark gray "$900M" with explanatory subcopy and a small help icon about cloud-equivalent cost. Bottom half is a full-bleed photograph down a symmetrical server aisle with cool overhead lighting. White block lettering "AHREFS DATACENTER" overlays the image with orange script "in Singapore" layered on top. Centered near the bottom, a white play icon and "Watch reel" text indicate an embedded or linked video.
Key takeaway
Hardware stats in a tight orange grid make abstract scale tangible, and the cost comparison ($900M) adds a business argument beyond raw numbers. The datacenter photo with location callout humanizes infrastructure without cluttering the metrics block.
Reuse notes
Strong for B2B platforms selling reliability and proprietary infrastructure. Needs a real photo or footage; stock alone may feel generic. Video CTA is only appropriate if a reel exists. Top copy block is text-heavy; shorten for audiences that will only scan the stats.
More like this
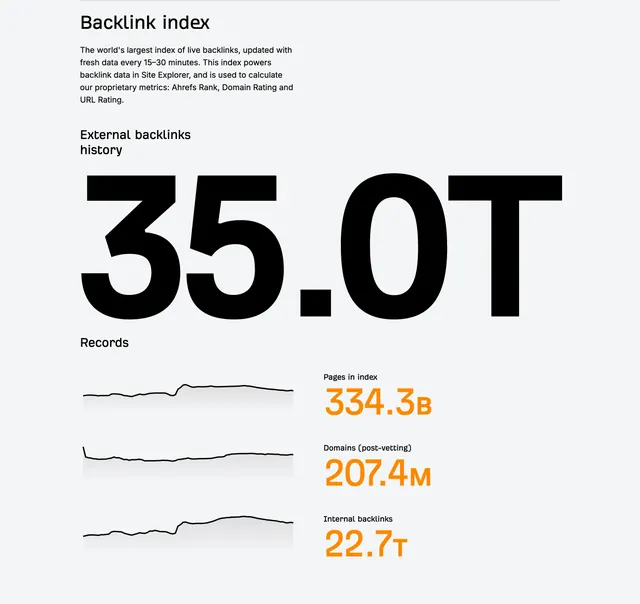 Ahrefs backlink index statistics
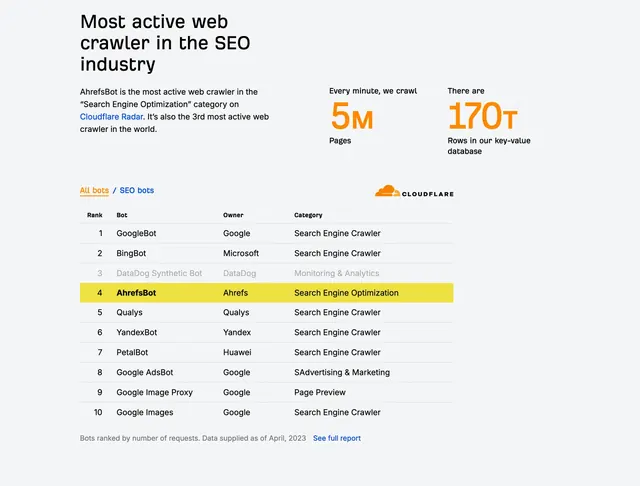 Ahrefs crawler activity statistics
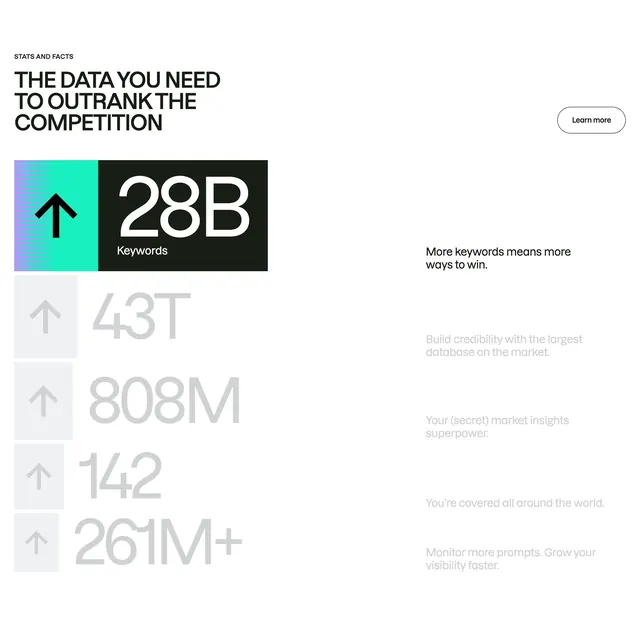 Semrush scroll-synced stats feature
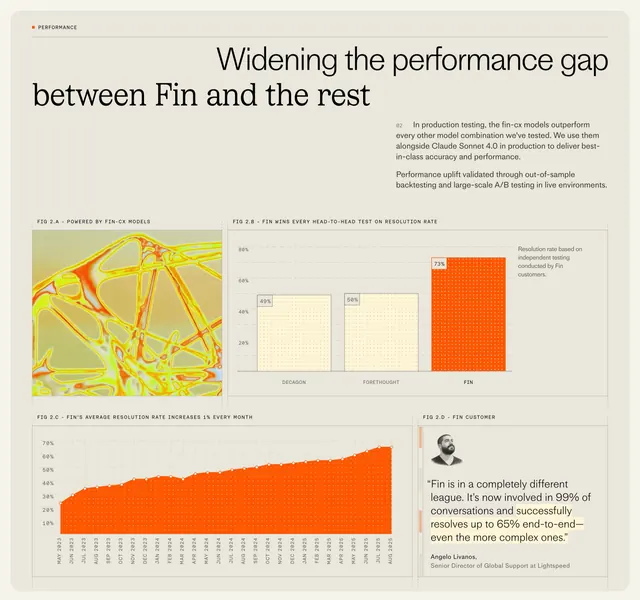 Fin CX model performance data grid
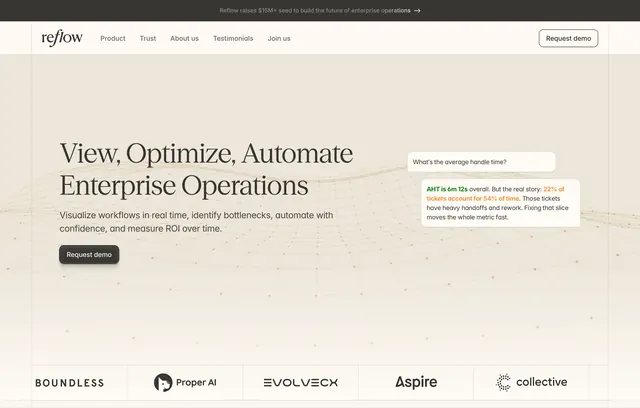 Reflow enterprise operations hero
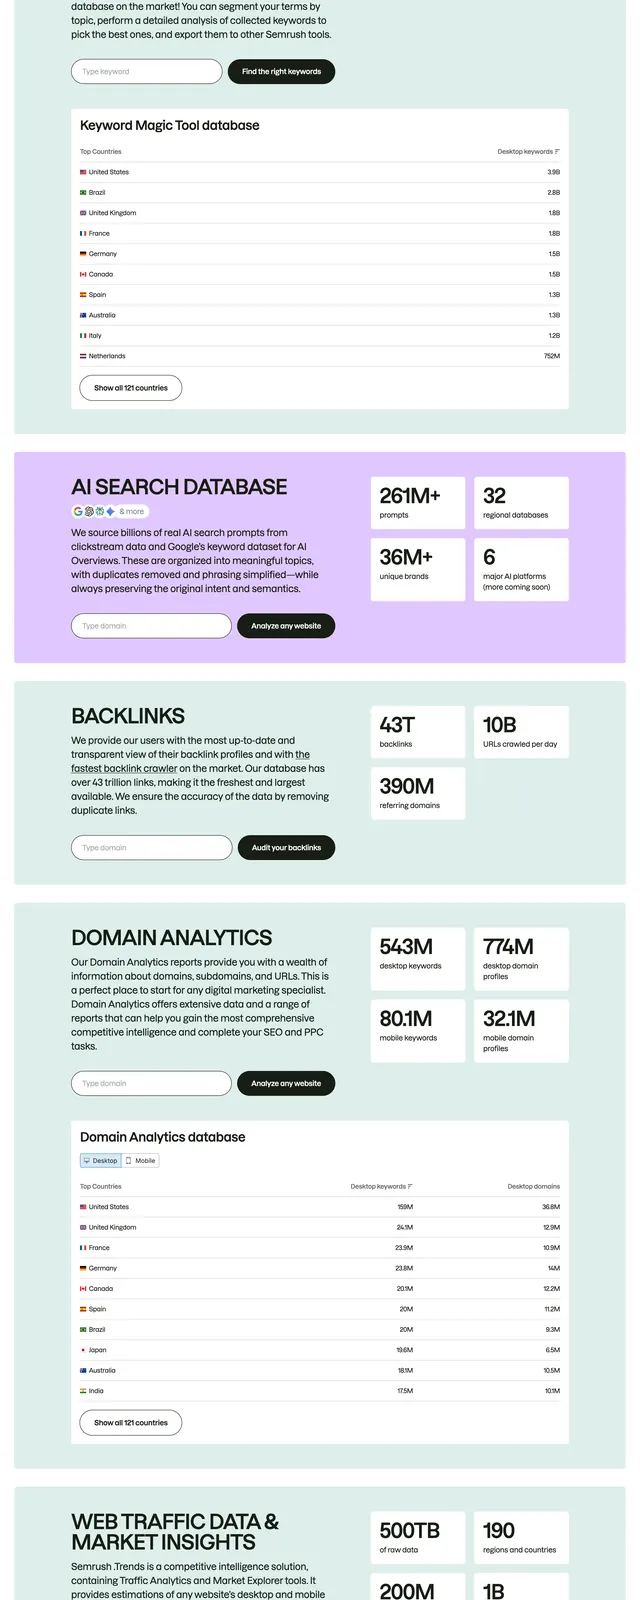 Semrush stacked data feature blocks
 Equip employee financial well-being stats
 Ahrefs all-in-one SEO toolset section
 Wayflyer customer success filmstrip gallery
 Clarisights marketing dashboard hero
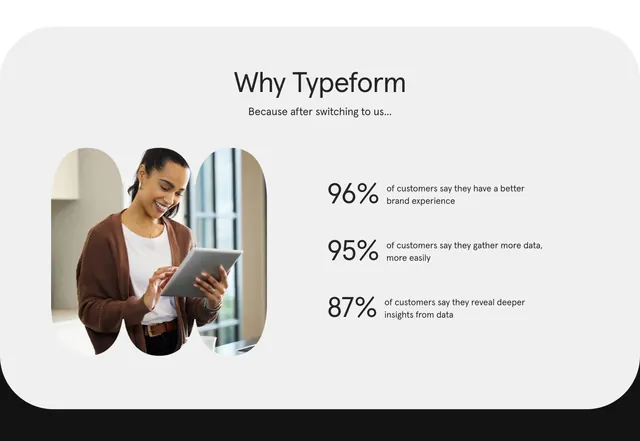 Typeform stats section with triple-pill photo
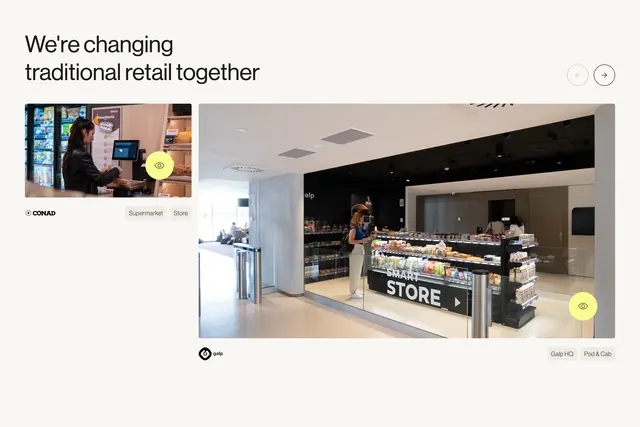 Sensei retail transformation case study carousel
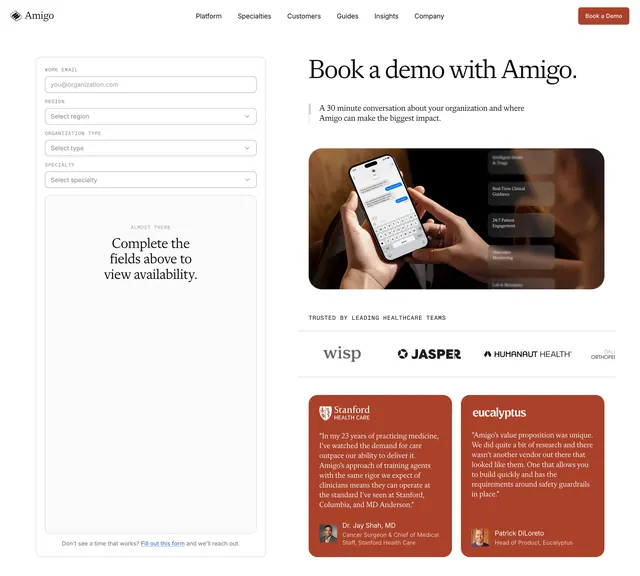 Amigo demo booking hero design
 Maze insights-to-outcomes metric cards
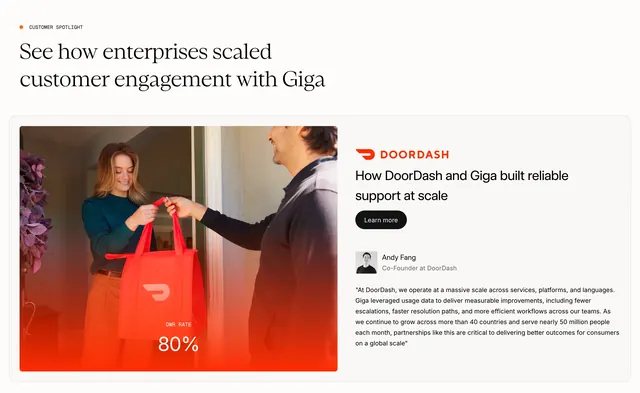 Giga DoorDash customer spotlight testimonial
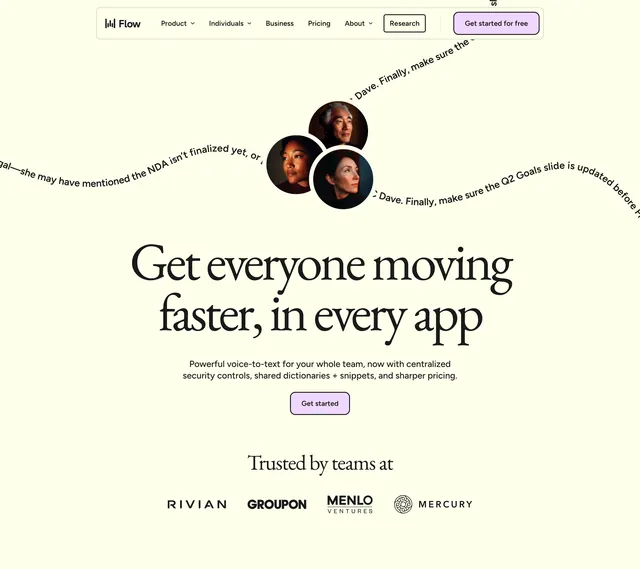 Flow team productivity hero
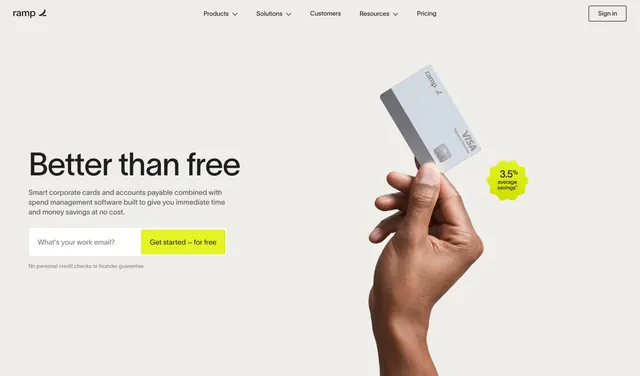 Ramp pricing better than free hero
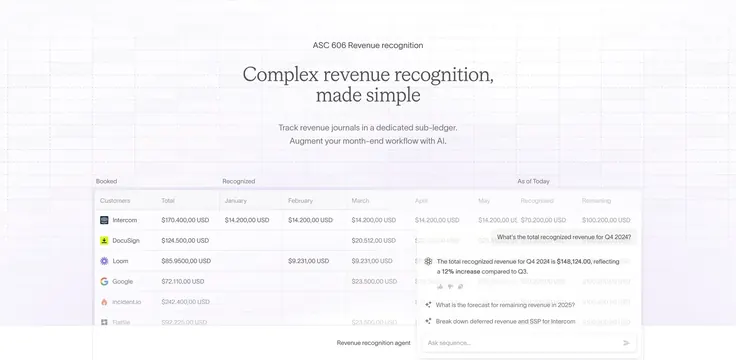 Sequence ASC 606 revenue table with AI agent overlay
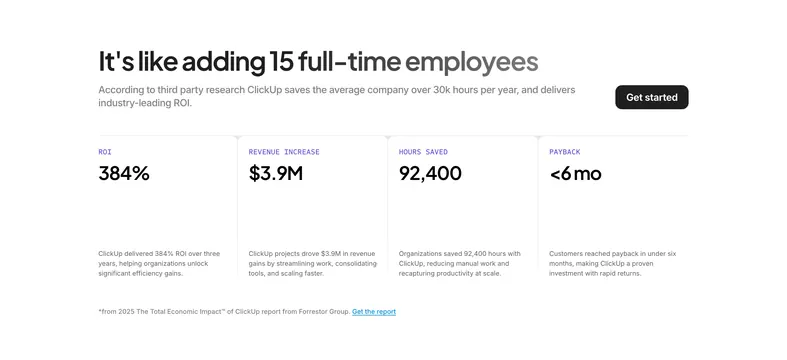 ClickUp Forrester ROI statistics grid
 Function professional medical board team grid
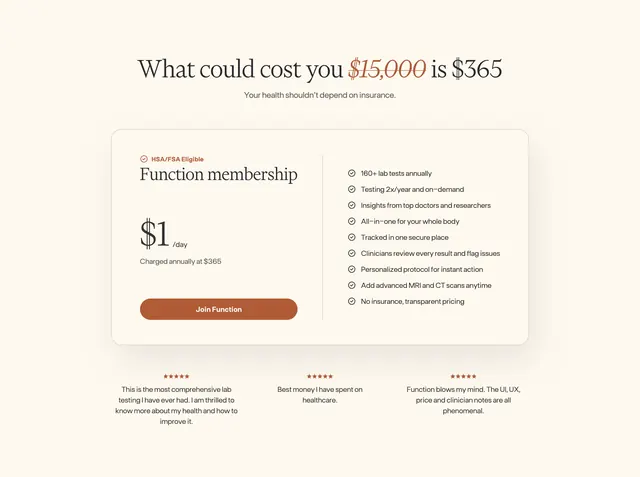 Function membership pricing section
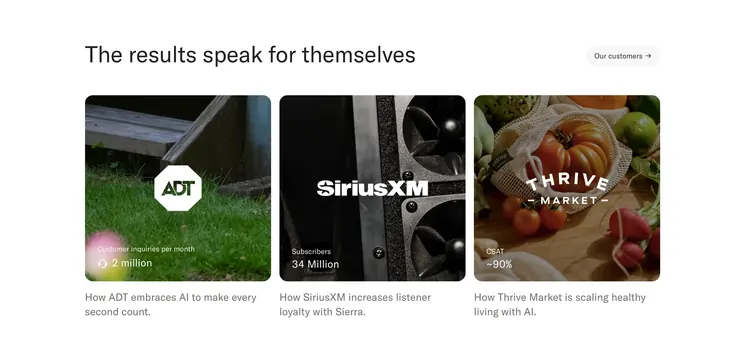 Sierra customer results three-up cards
 Holocene Supply Planning bento
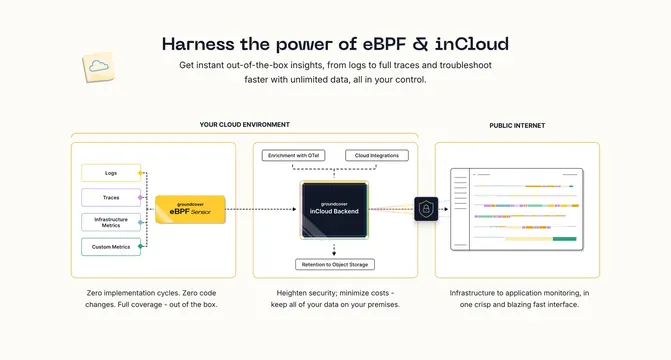 Groundcover architecture how-it-works