Data Visualization and Infographic Design
A structured presentation of information through visual hierarchy, icons, and organized typography, emphasizing clarity and understanding.

Summary
A structured presentation of information through visual hierarchy, icons, and organized typography, emphasizing clarity and understanding.
Visual description
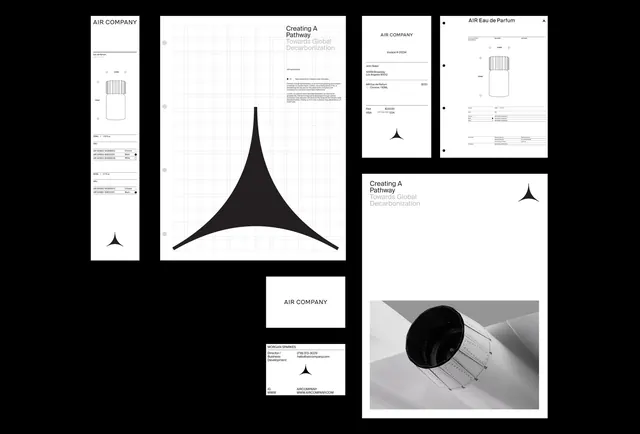
A complex infographic layout organized into clear sections or columns, likely 2-3 columns. Uses a combination of typographic hierarchy, icons, and possibly small charts or diagrams to communicate information. Black typography on white or light gray background. Icons act as visual anchors for different categories. Information is presented in a logical, top-to-bottom flow with clear visual breaks between sections. Clean sans-serif fonts emphasize legibility and professionalism.
Key takeaway
Systematic visual hierarchy using size, weight, color, and position. Icons as semantic shortcuts reducing text density. Grid-based layout that organizes complex information into digestible chunks.
Reuse notes
Essential for B2B, education, reports, or any content-dense context. The structured layout supports scanning and quick comprehension. Monochrome palette limits visual distraction. Requires substantial content to justify the grid—risks feeling empty if information is light.
More like this
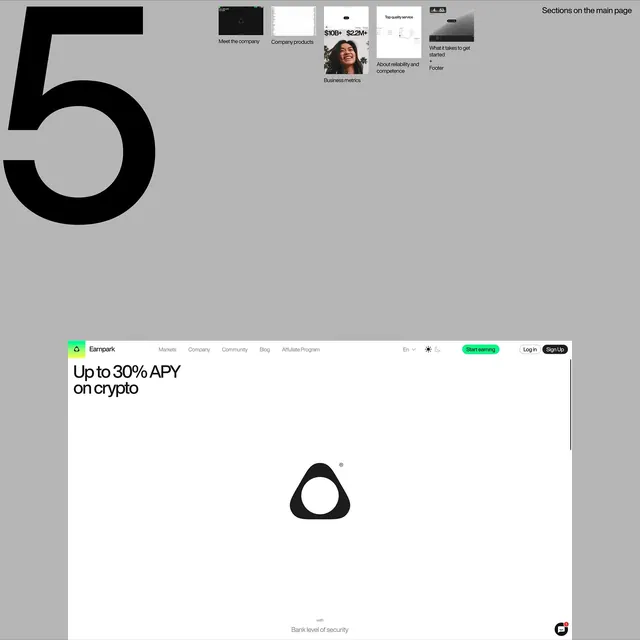 Crypto yield platform with bold number hierarchy and product grid
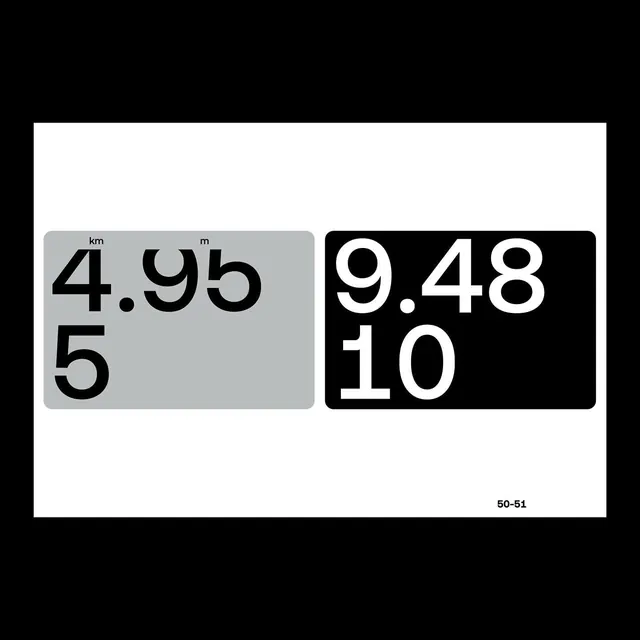 Typography comparison card design
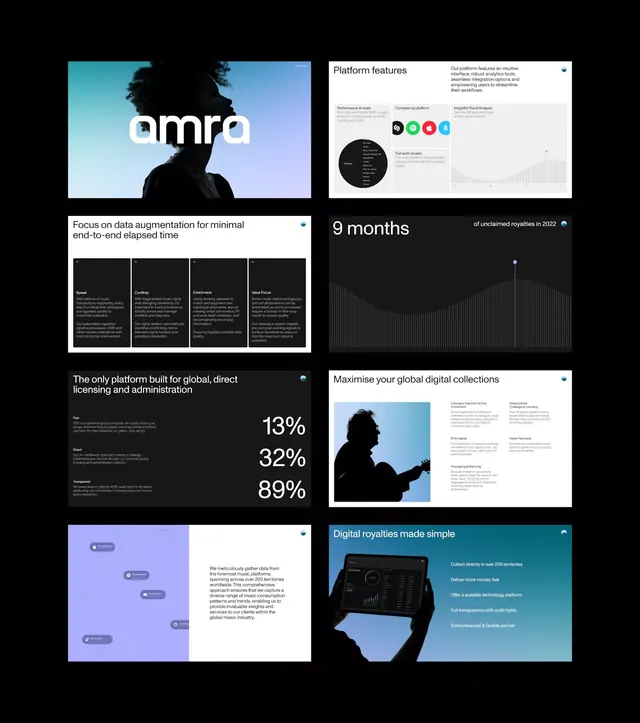 Multi-slide fintech platform deck with data visualizations
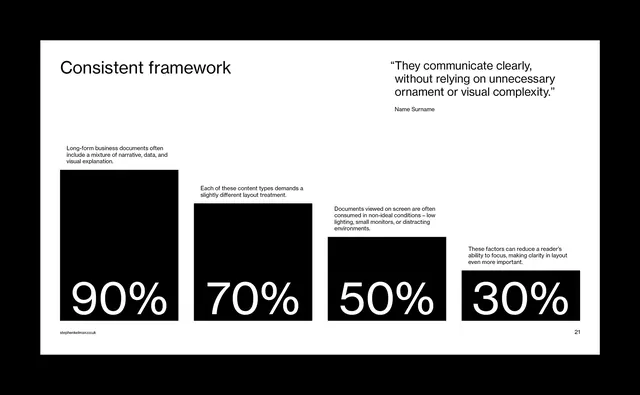 Document clarity hierarchy diagram
 Technical diagram with structured hierarchy
 MMUSA product line slide with angled geometric blocks
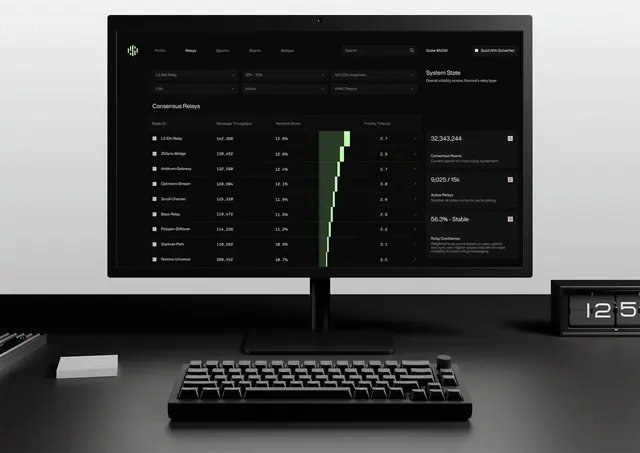 Dark-mode network relay monitoring dashboard
 Technical Typography Layout
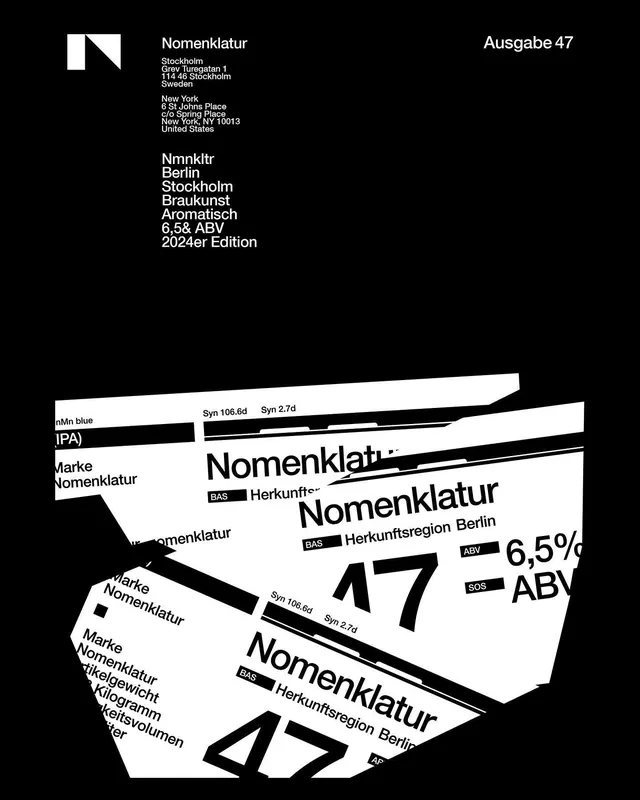 Nomenklatur Ausgabe-47 Identity System
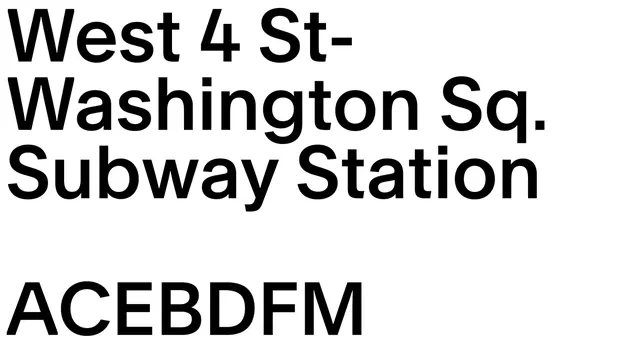 NYC subway wayfinding typography
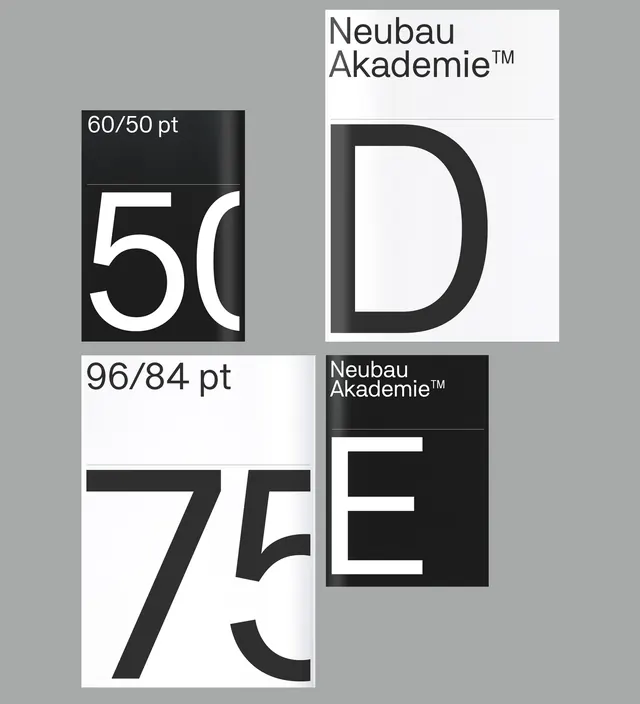 Neubau Akademie typeface test kit layout
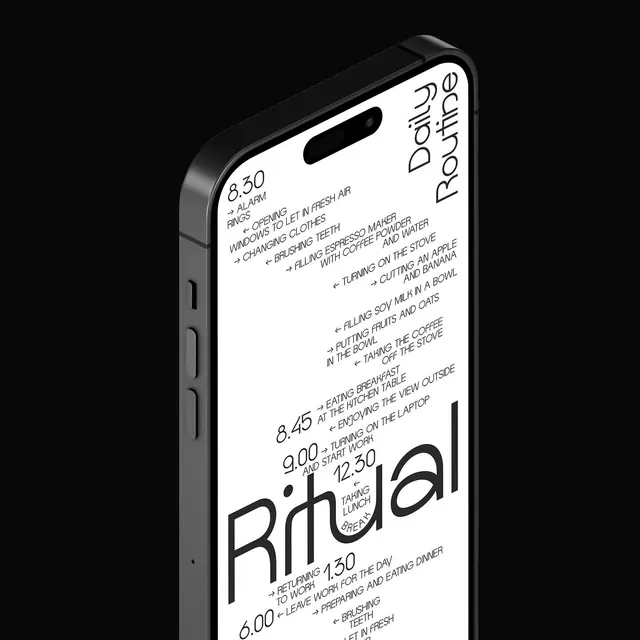 RITUAL Smartphone Mockup
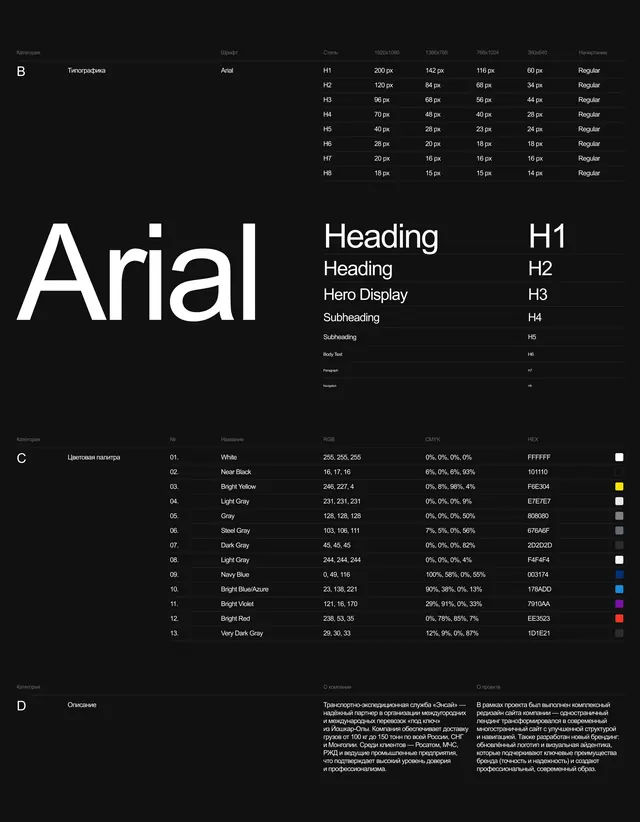 Arial Type Specimen and Data Visualization Layout
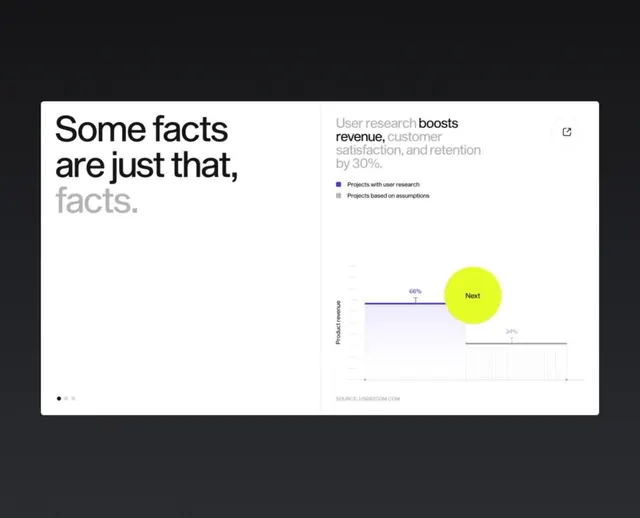 Research impact metric slide with lime accent circle
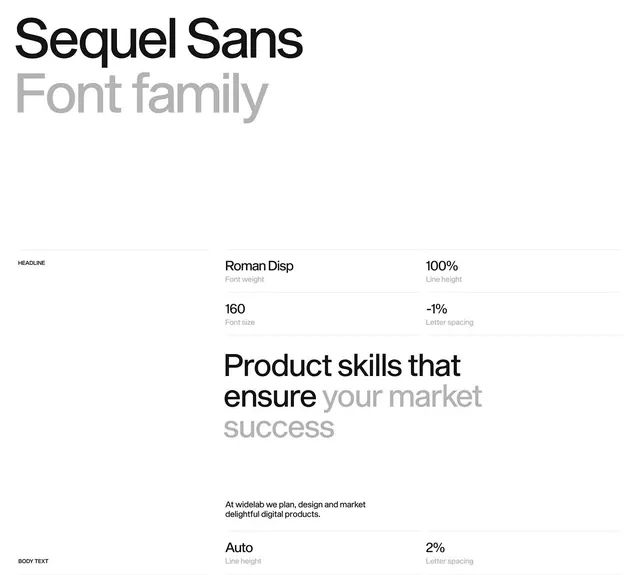 Sequel Sans type specimen sheet
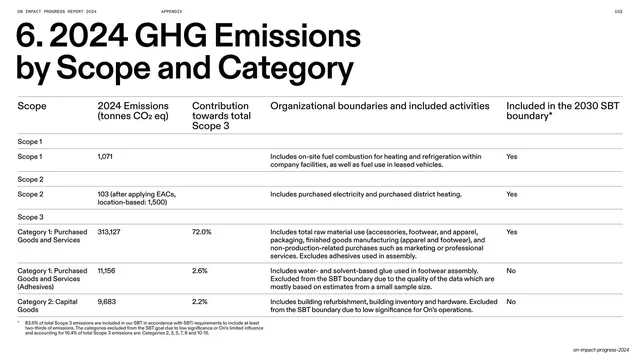 2024 GHG emissions by scope and category table
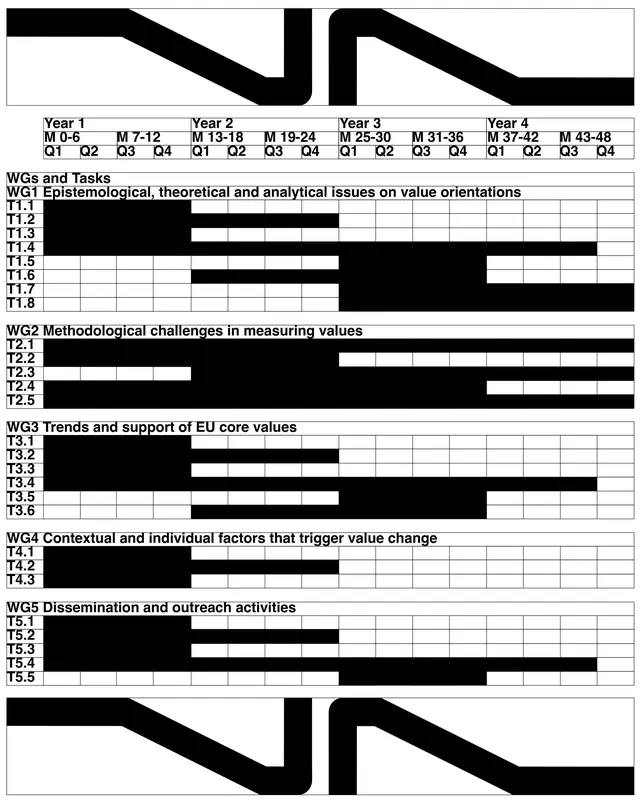 Vista research project identity system (slide 1)
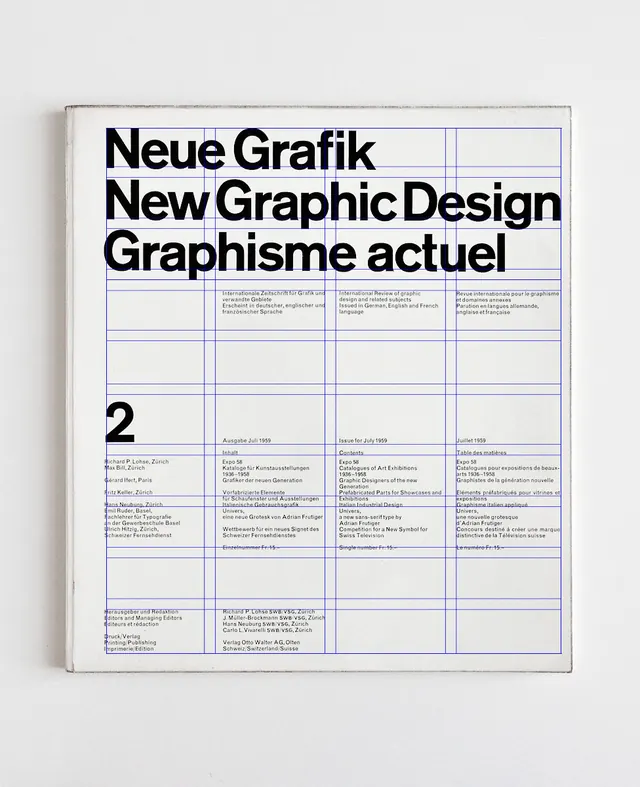 Neue Grafik / New Graphic Design Poster
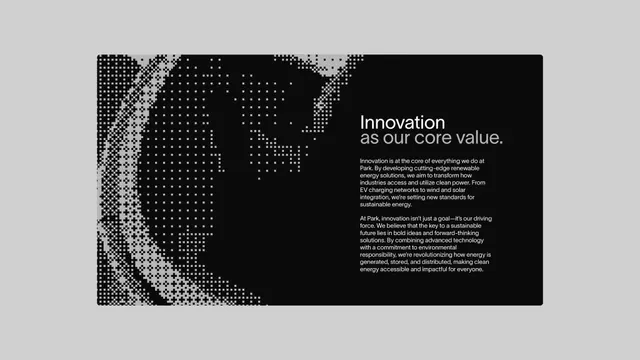 Park renewable energy brand innovation statement with pixelated world map
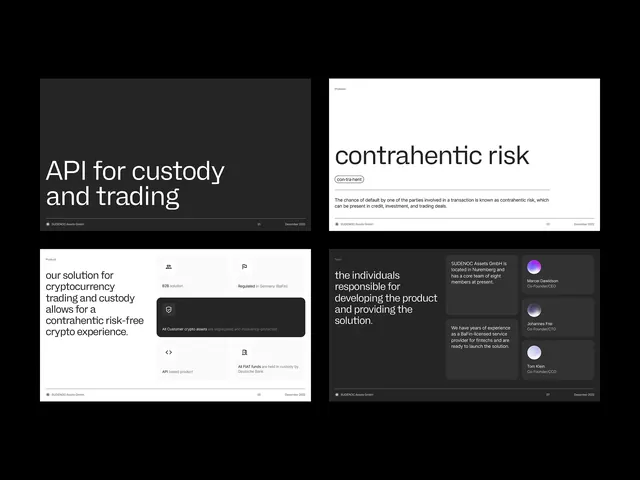 Fintech dashboard presentation mockup set
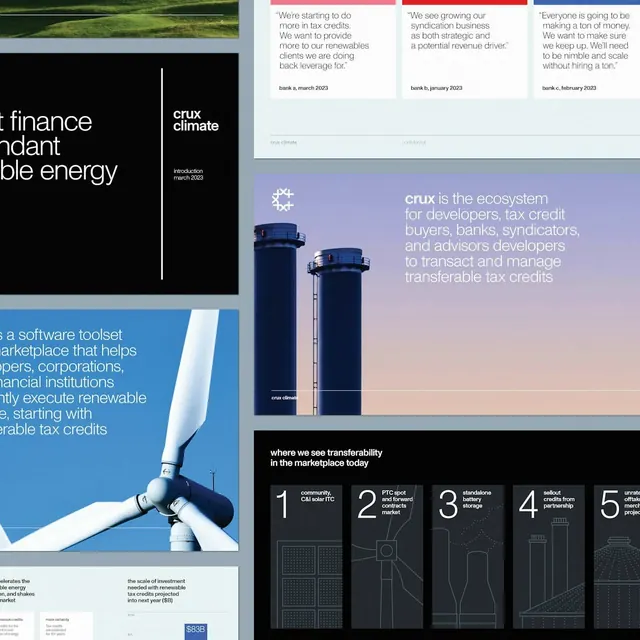 Crux fintech platform UI composition
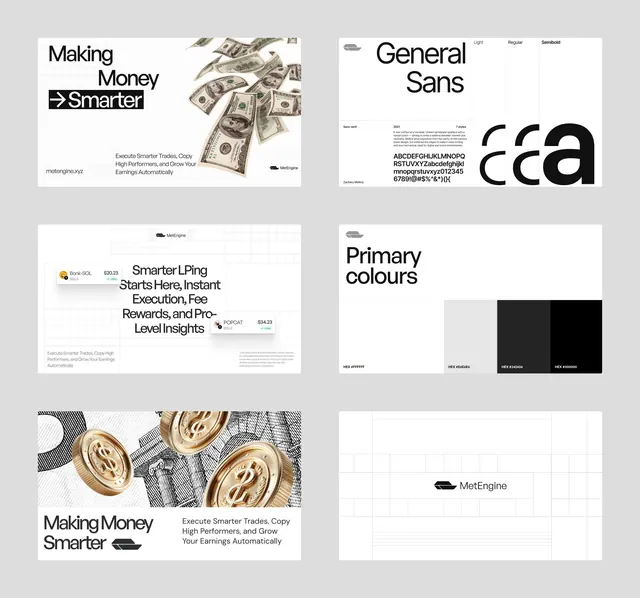 MetEngine fintech design system collage
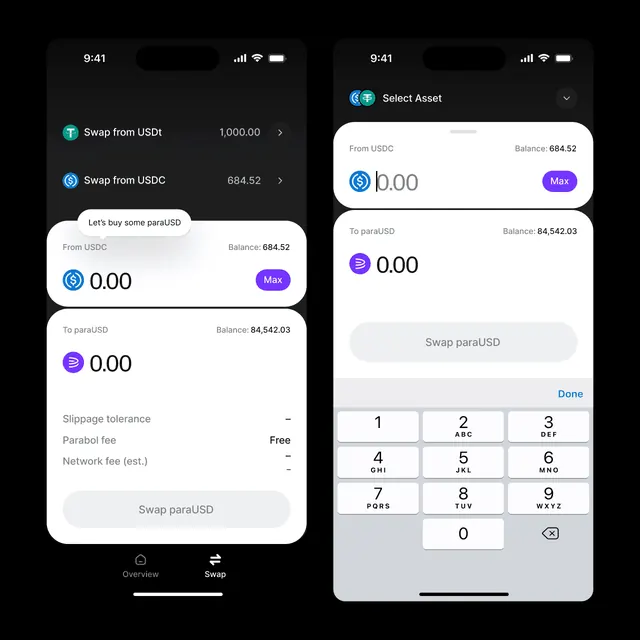 Crypto swap UI dark mode interface
 Abstract Geometric Identity System