Preservation Project Data Visualization
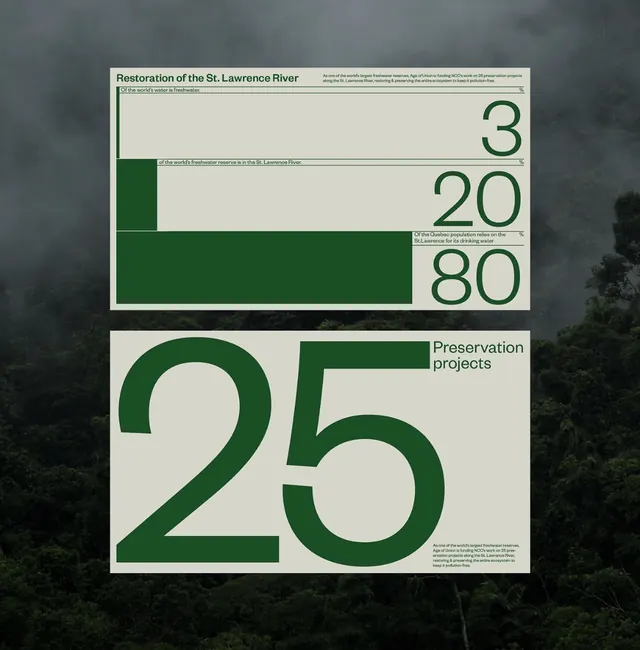
A data-driven graphic featuring a large numerical breakdown of the 'Restoration of the Lawrence River' project, set against a dark, atmospheric forest background.
Summary
A data-driven graphic featuring a large numerical breakdown of the 'Restoration of the Lawrence River' project, set against a dark, atmospheric forest background.
Visual description
The design features a large white box containing a green bar chart and oversized numbers (3, 20, 80) representing project data. The background is a moody, dark photograph of a dense forest.
Key takeaway
The design effectively uses high-contrast typography and a structured grid to make complex environmental data easily digestible.
Reuse notes
This layout can be adapted for any project requiring a clear, impactful breakdown of statistics or milestones.
More like this
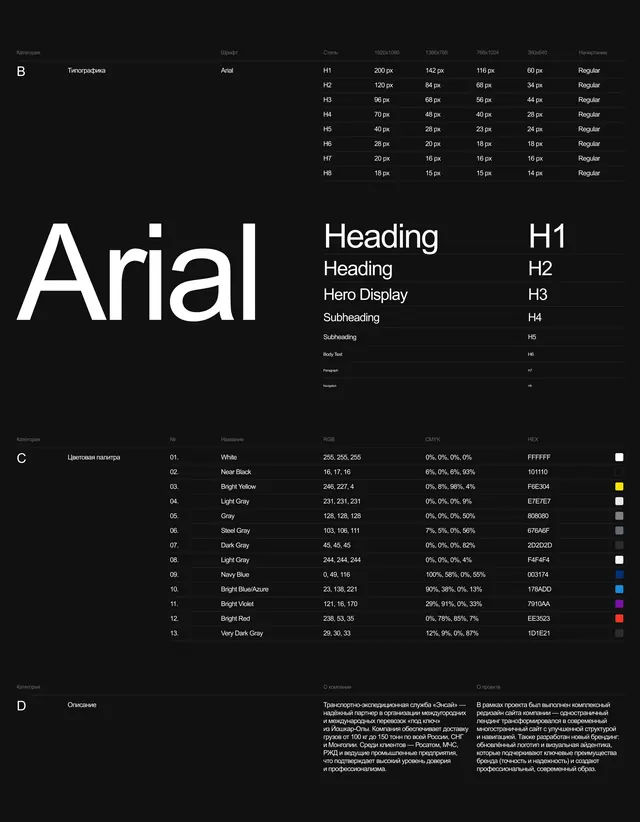 Arial Type Specimen and Data Visualization Layout
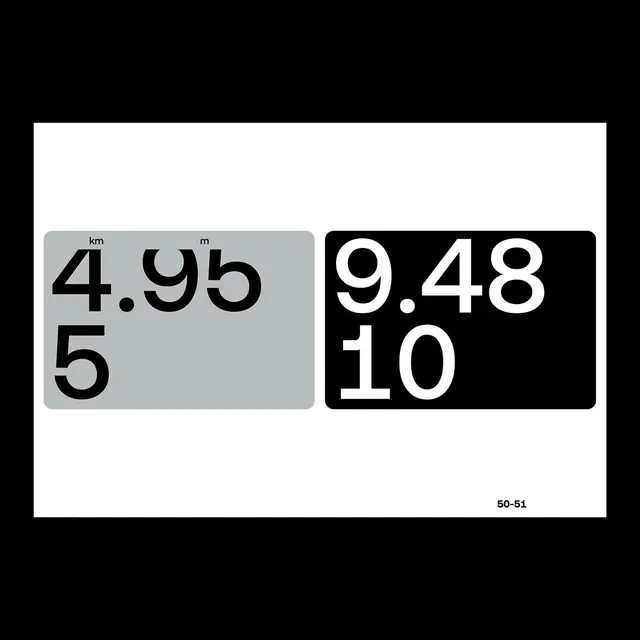 Numeric Type Specimen
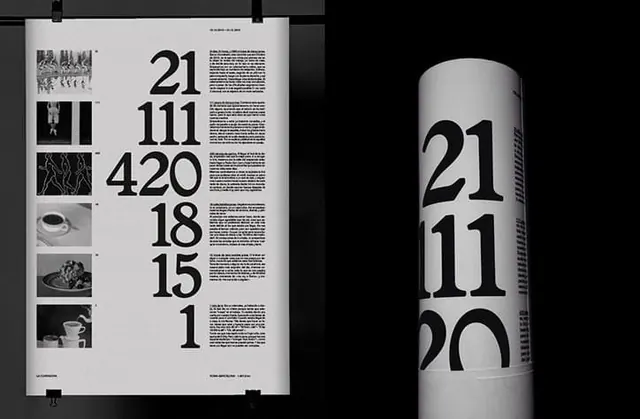 Data-Driven Typography Layout
 Typography-Driven Poster Design
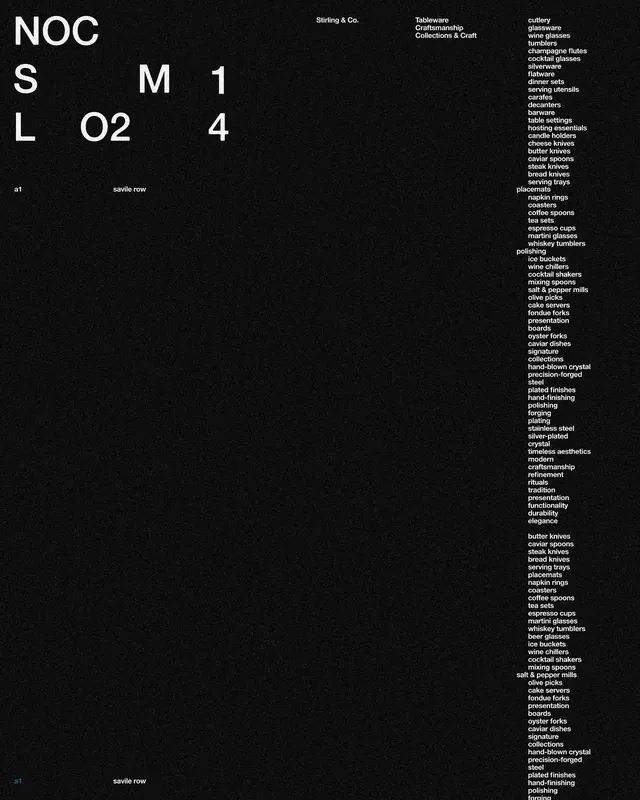 NOCSLM4 Typography Layout
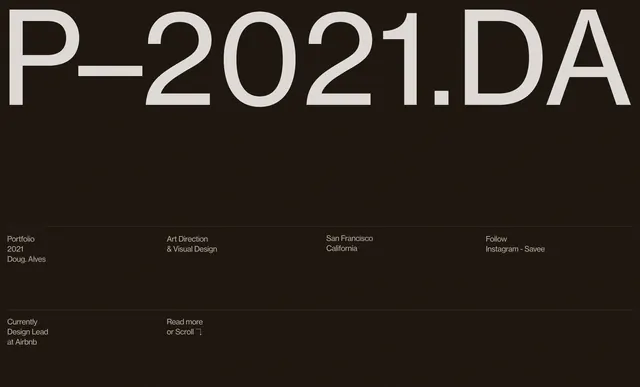 P-2021.DA Typography Layout
 Abstract Geometric Line Pattern
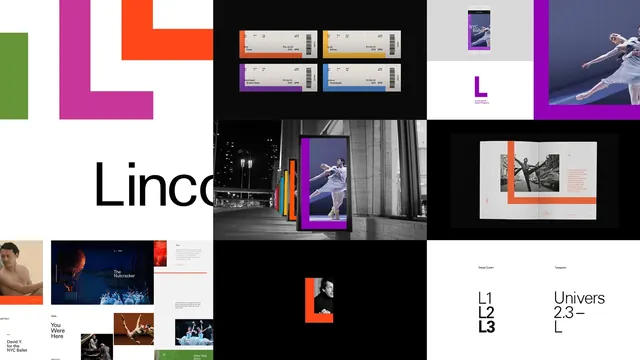 Geometric and Typographic Identity System
 Geometric Grid Pattern
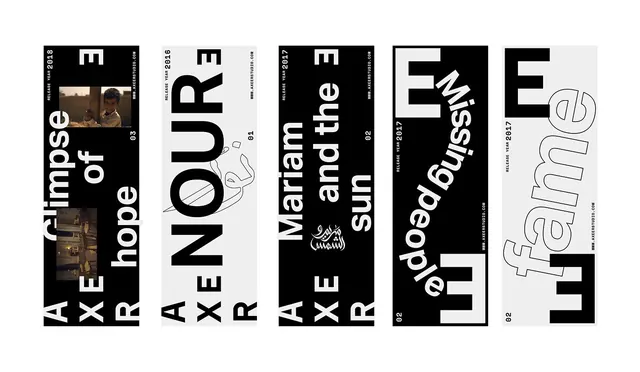 Typography and Graphic Design Reference Board
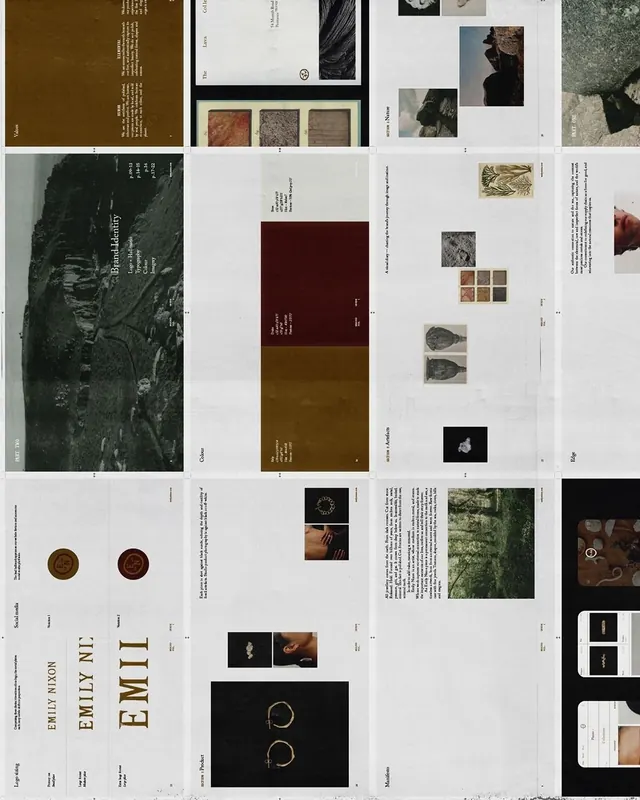 Editorial and Identity Layout Collection
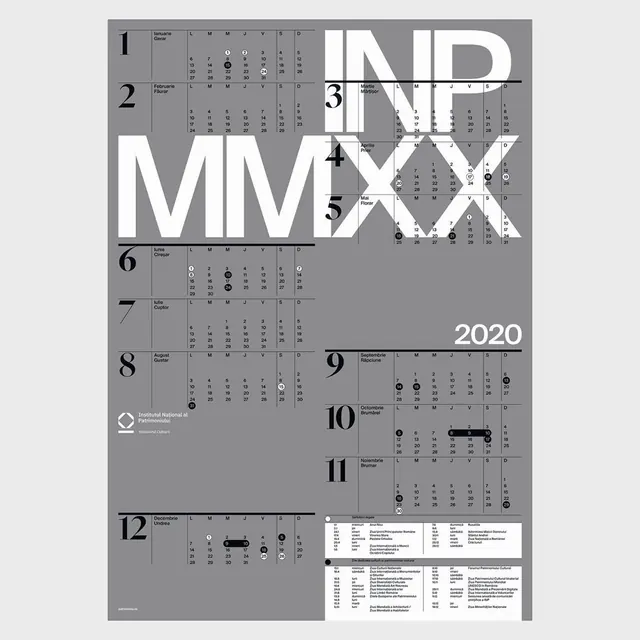 2020 Calendar Infographic Design
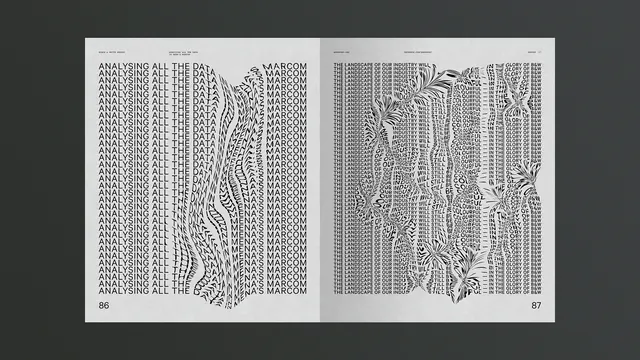 Typography and Data Visualization Spread
 Geometric Grid and Circle Composition
 Bold Wordmark Mockup
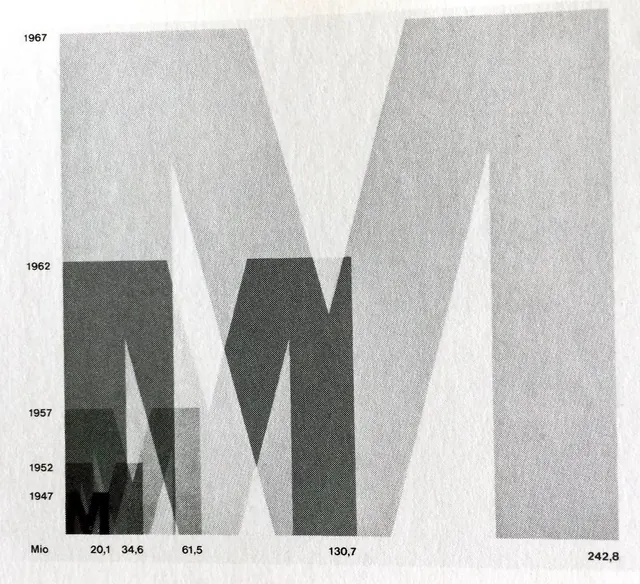 Abstract Geometric Data Visualization
 Typography and Distance Data Visualization
 Grid-Based Graphic Design Reference
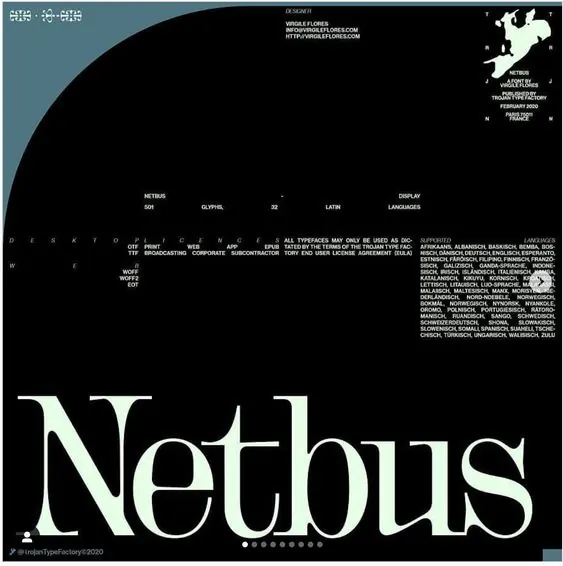 Netbus Identity System
 mild14 Wordmark Mockup
 Apollo 11 Technical Display
 Outsider Observations Collaborative Research Center Identity
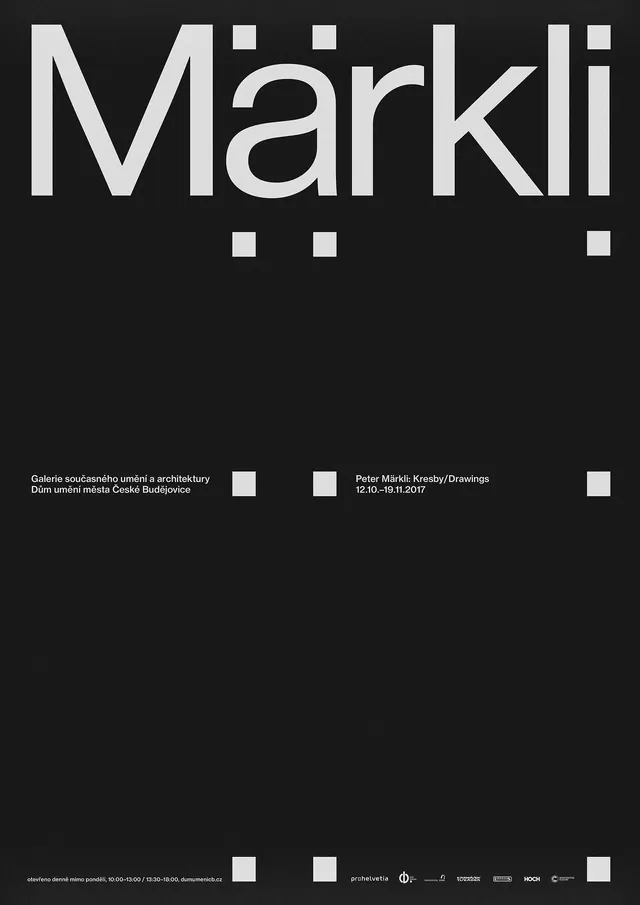 Märkli Wordmark and Layout
 Geometric Line Art Abstract