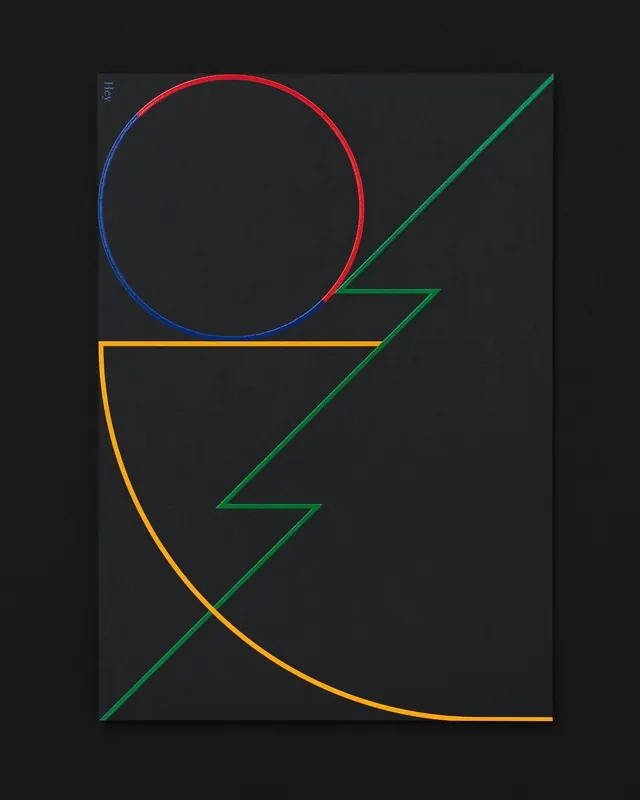
Neon curve intersection diagram
Dark background with bold neon-colored curved and angular lines creating an abstract geometric composition with red, blue, green, and orange strokes.
Summary
An abstract geometric composition on a dark background featuring bold neon-colored curves and lines—red, blue, green, and orange—intersecting and layering to create dynamic visual tension.
Visual description
A dark charcoal background hosts four main colored strokes: a red circle, a blue curve on the left, a green angular zigzag, and an orange curved arc at the bottom. The shapes overlap without strict intersection, suggesting movement and spatial depth through layering. Clean, glowing line work with no fill.
Key takeaway
Restrained color palette and geometric abstraction combined with neon stroke weight create modern visual sophistication while maintaining playful energy.
Reuse notes
Excellent for tech branding, app interfaces, or poster design. The neon-against-dark approach works well for contemporary music, gaming, or digital product launches. Useful as a pattern or divider in design systems.
More like this
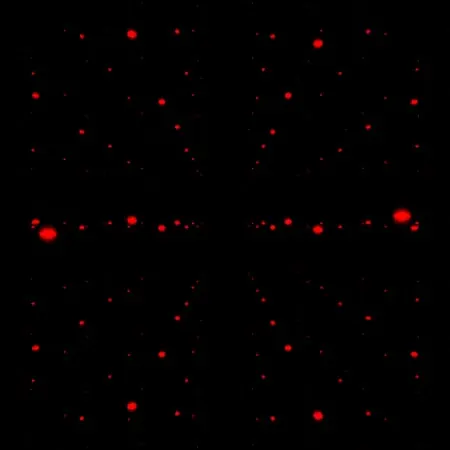 Abstract red dot pattern on black background
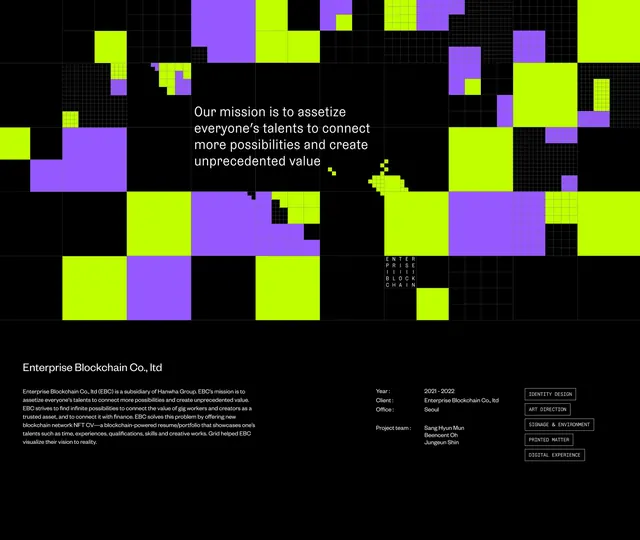 Blockchain Data Visualization Grid
- Cinema advertisement with lime-green all-caps type on forest-green
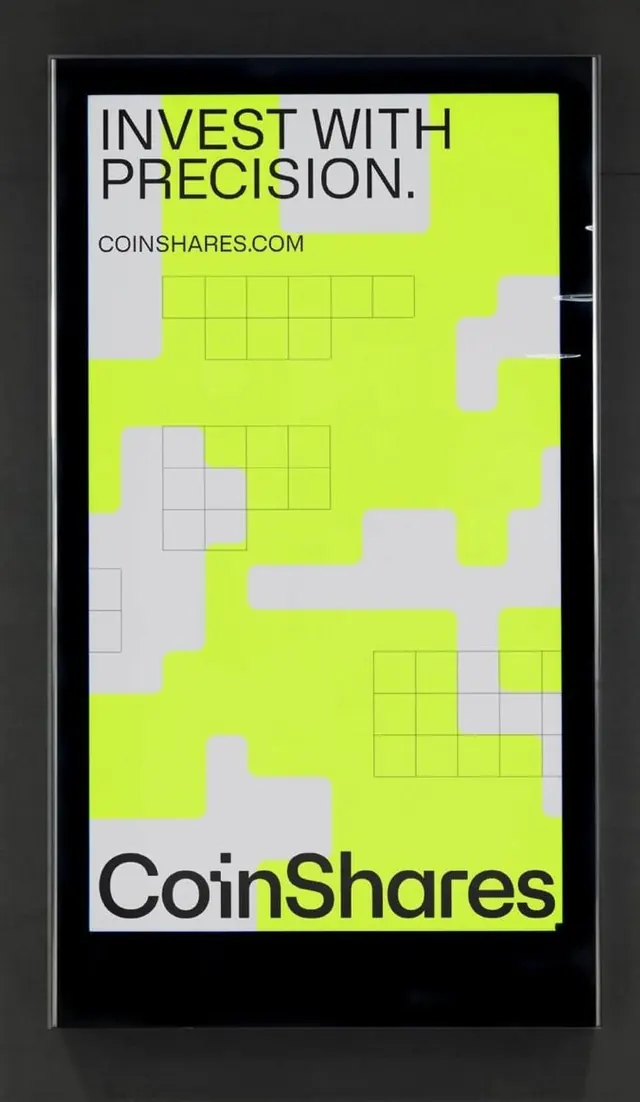 CoinShares investment poster neon geometric grid
 Abstract generative art with rainbow gradient mesh
 Design school full-page layout, modular sections
 Global Connectivity Data Visualization
 Digital Circuitry Data Visualization
 Modulik abstract geometric composition with bold wordmark
 Conoco el festival neon wayfinding graphic
 Abstract Neon Typography and Texture
 Glowing orange abstract geometric form
 Navy and orange geometric grid outdoor billboard
 Red line abstract geometric composition
 Abstract Face Illustration with Geometric Accents
 Abstract Radial Light Burst with Central Text
 Abstract Red and White Geometric Graphic
 Red Pixel Grid Pattern
 3D geometric shapes in glass capsules
 Minimal playful abstract graphic
 Abstract Architectural Interior with Neon Accent
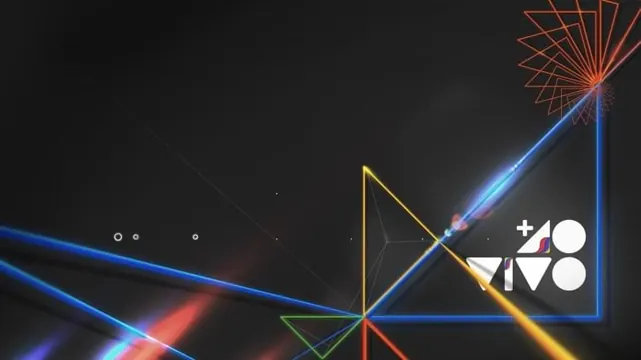 Abstract Geometric Line Art
 Circular data visualization with audio waveform pattern
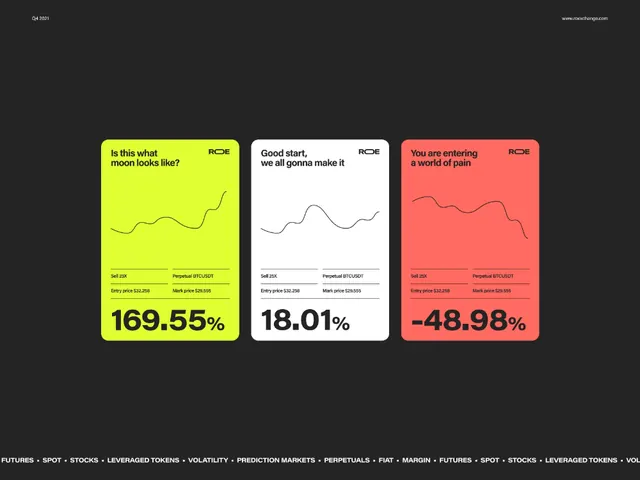 Bitcoin price-change dashboard with three-card layout