Geometric Data Visualization Diagram
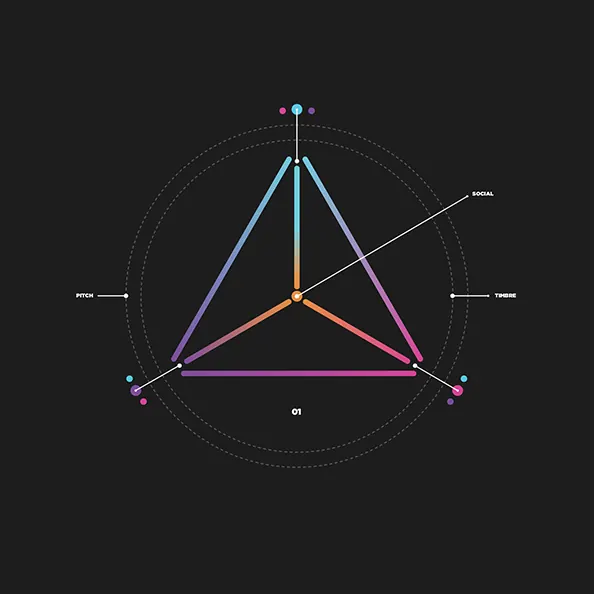
A minimalist, dark-mode infographic featuring a central triangle connected to three axes labeled 'PITCH', 'SOCIAL', and 'TIMBRE'.
Summary
A minimalist, dark-mode infographic featuring a central triangle connected to three axes labeled 'PITCH', 'SOCIAL', and 'TIMBRE'.
Visual description
A central triangle with gradient-colored edges sits within two concentric dashed circles on a black background. Three thin lines extend from the triangle's vertices to labeled points on the outer circle. Small, colorful dots accent the terminal points of the axes.
Key takeaway
Use thin gradient lines and concentric dashed circles to create a sophisticated, technical aesthetic for multi-dimensional data.
Reuse notes
Ideal for representing complex relationships or multi-variable metrics in a clean, modern interface.
More like this
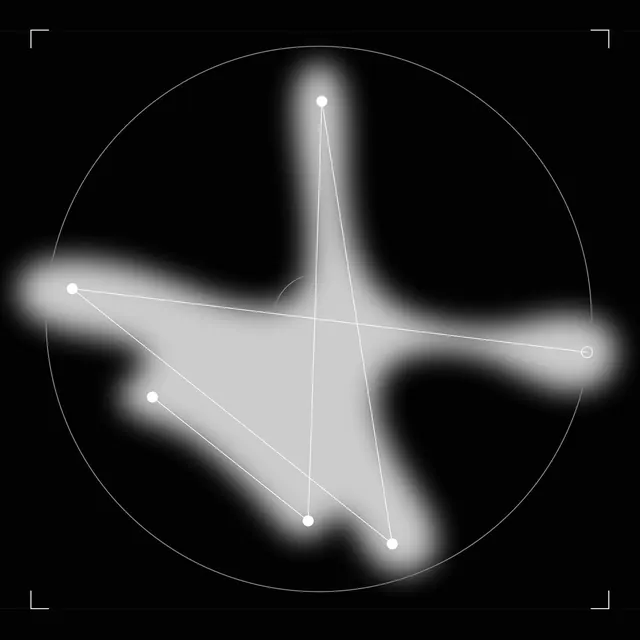 Abstract minimal data viz
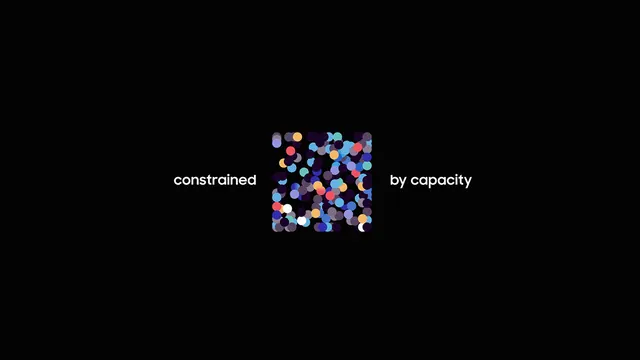 Circle-packing chart: constrained by capacity
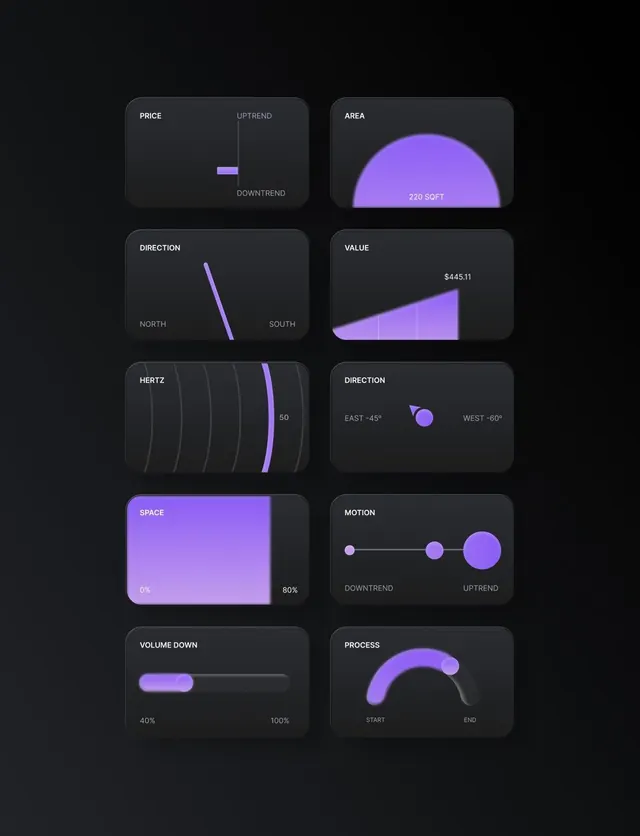 Minimal dark-mode data viz
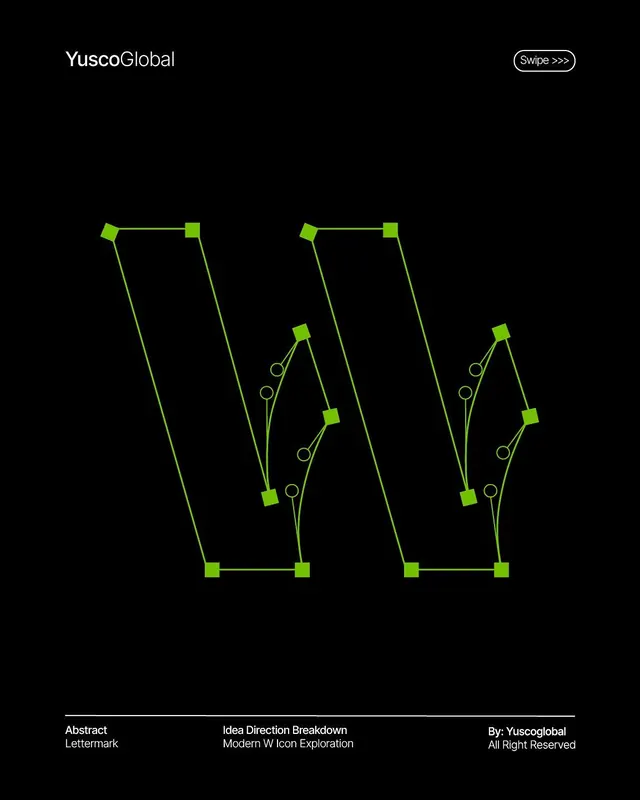 Minimal geometric data viz
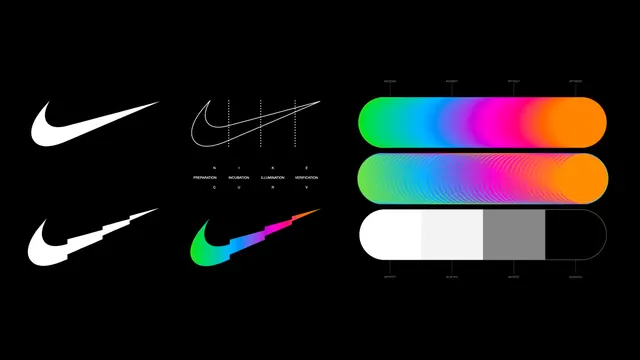 Logo Construction and Color Specimen Reference
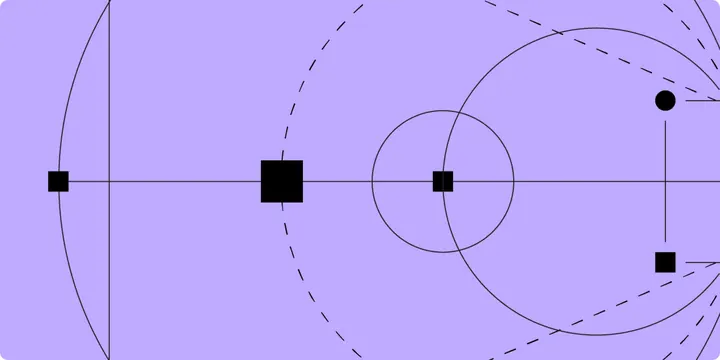 Abstract geometric data viz
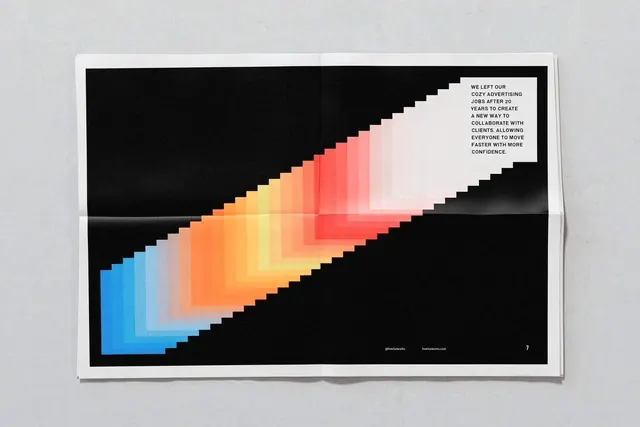 Data-dense minimal data viz
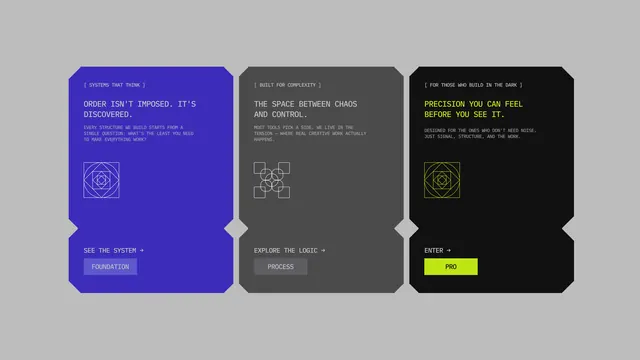 Three Vertical Graphic Panels
 Abstract Gradient Overlap
 Minimal technical data viz
 Minimal abstract data viz
 Abstract 3D Identity System
- Minimal abstract data viz
 Hydelic Singularity X Album Cover
 Dark-mode gradient-heavy data viz
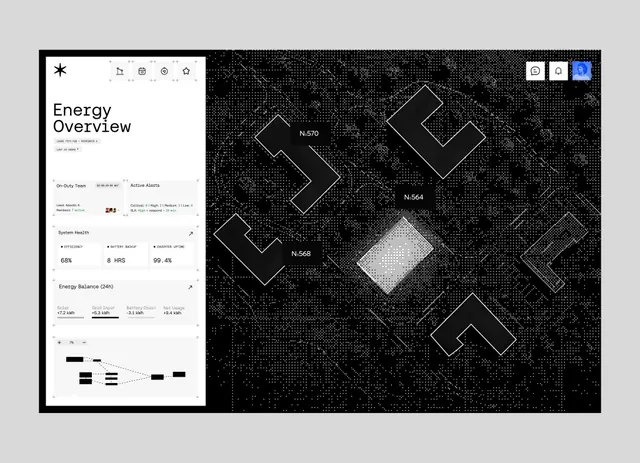 Dark-mode technical data viz
 Geometric Icosahedron Graphic
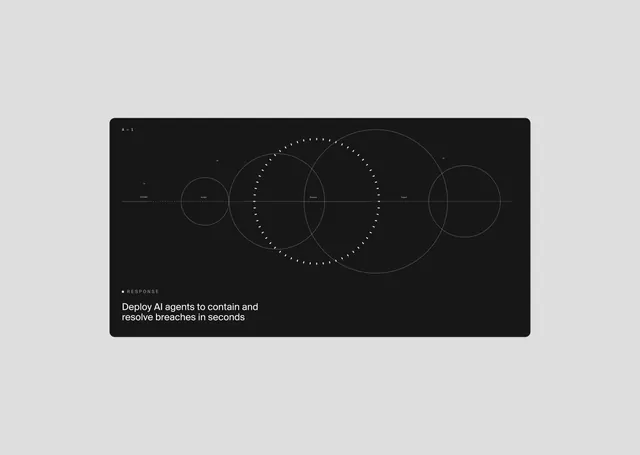 Minimal dark-mode data viz
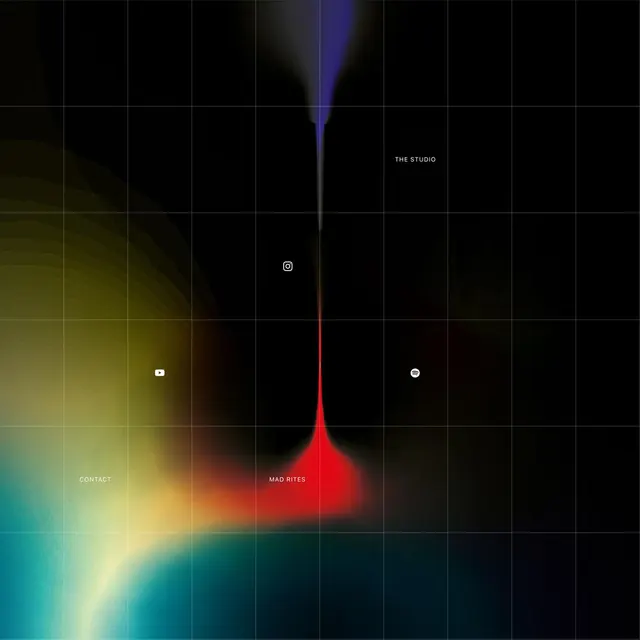 Abstract Gradient Grid Composition
 Minimal dark-mode data viz
 Teenage Engineering Product Showcase
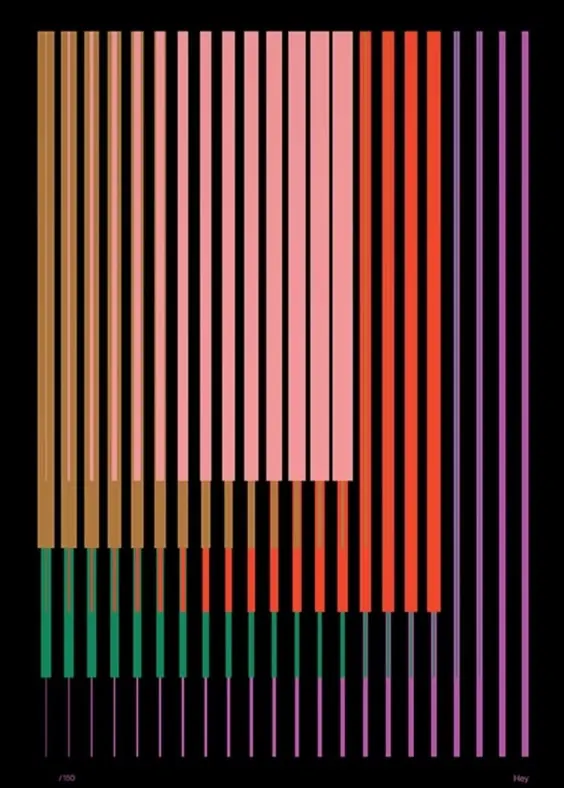 Color gradient spectrum chart
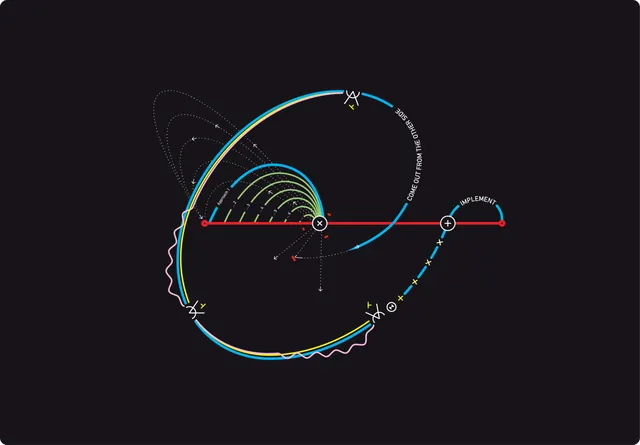 Abstract line-art data viz
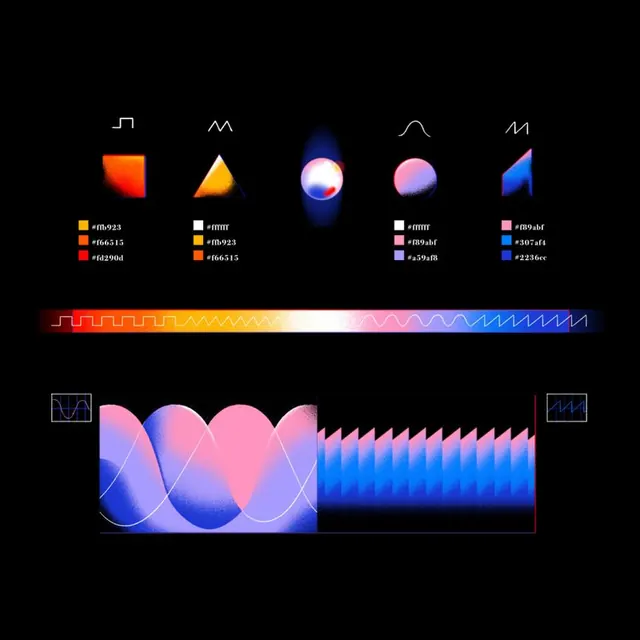 Abstract gradient-heavy data viz