Abstract concentric circles data visualization
An abstract infographic with concentric circular patterns in red, white, and blue with distorted wave-like deformations creating a fingerprint-like composition.

Summary
An abstract data visualization featuring overlapping concentric circular patterns in warm reds and cool blues, distorted by wave-like deformations to create a fingerprint or spiral effect against a dark blue background.
Visual description
Vertical composition dominated by two stacked circular patterns. The upper circle features red and white concentric lines heavily distorted with curved wave patterns. The lower circle uses blue, white, and gold concentric rings with similar distortion. The dark blue background creates strong contrast, and the interplay of the two circles creates a sense of movement and spatial depth.
Key takeaway
The distortion of geometric patterns creates visual dynamism and suggests motion or transformation, making static data feel animated and engaging.
Reuse notes
Strong for science, analytics, or technology contexts. Effective for motion design, data visualization explainers, or identity systems emphasizing innovation and forward movement.
More like this
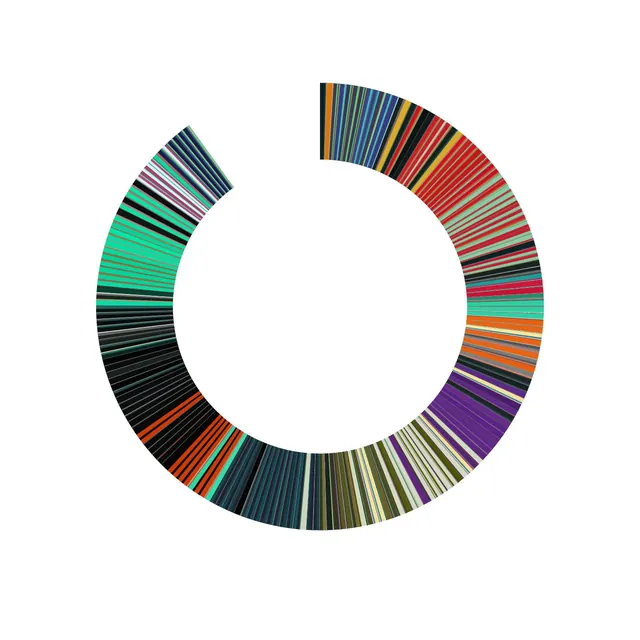 Data-dense abstract infographic
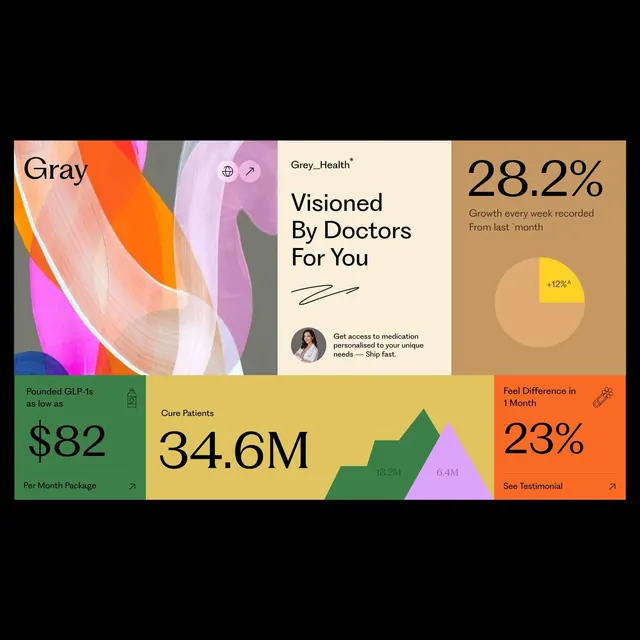 Infographic data-dense infographic
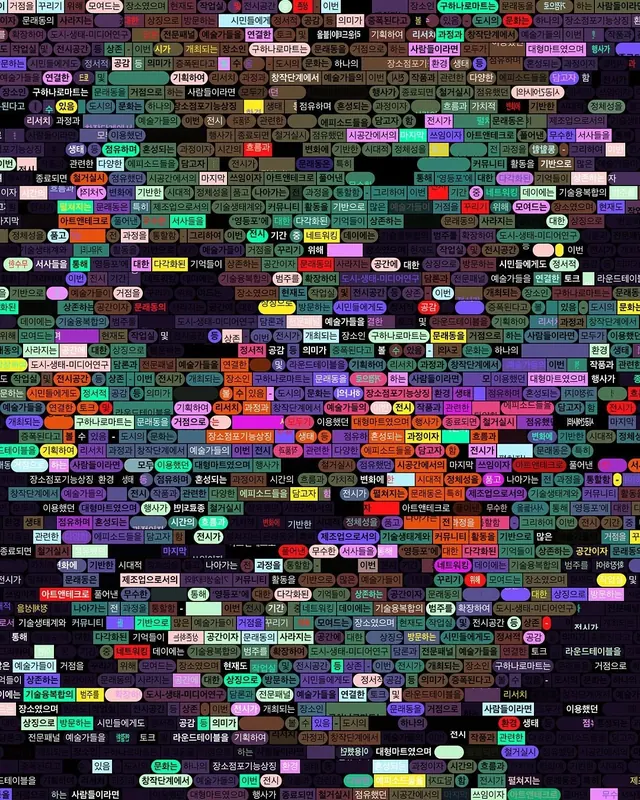 Dense data visualization with Korean text labels
- Gradient-heavy data-dense data viz
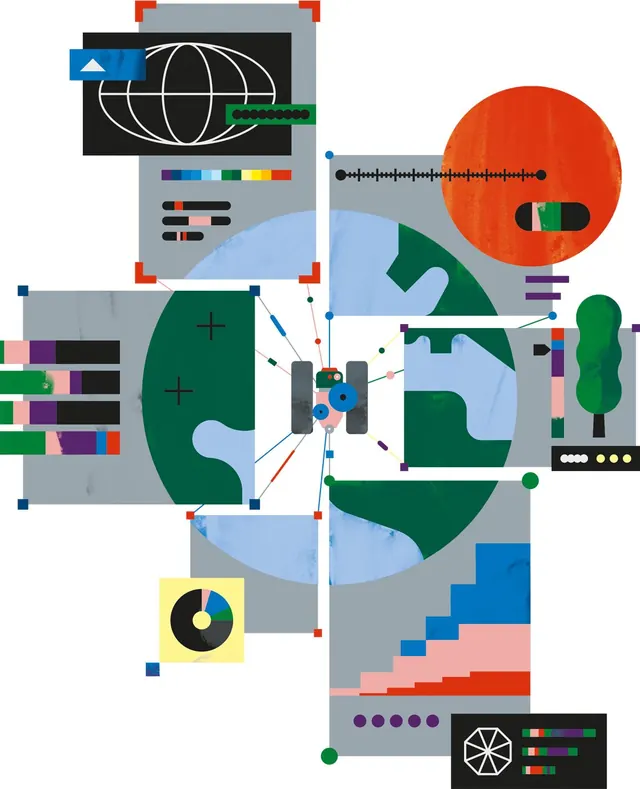 Geometric data-dense infographic
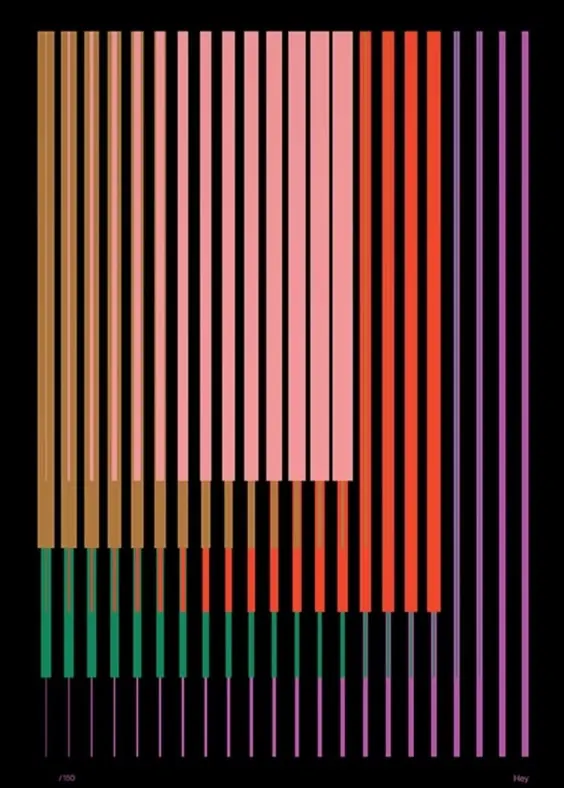 Color gradient spectrum chart
 Infographic gradient-heavy infographic
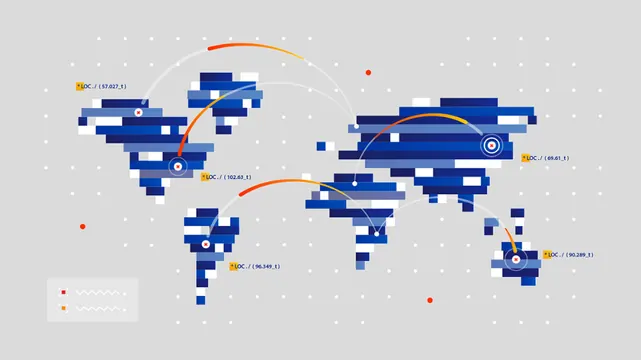 Data-dense infographic infographic
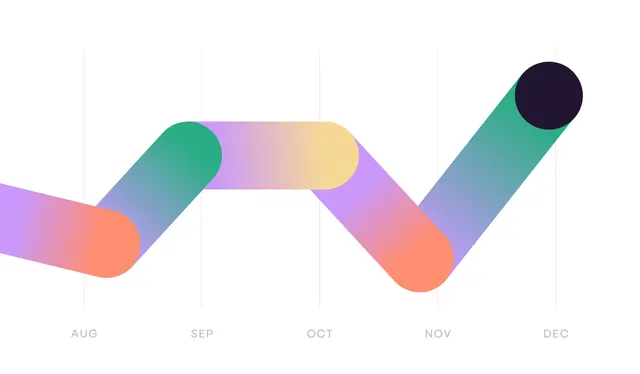 Minimal infographic infographic
 Abstract infographic infographic
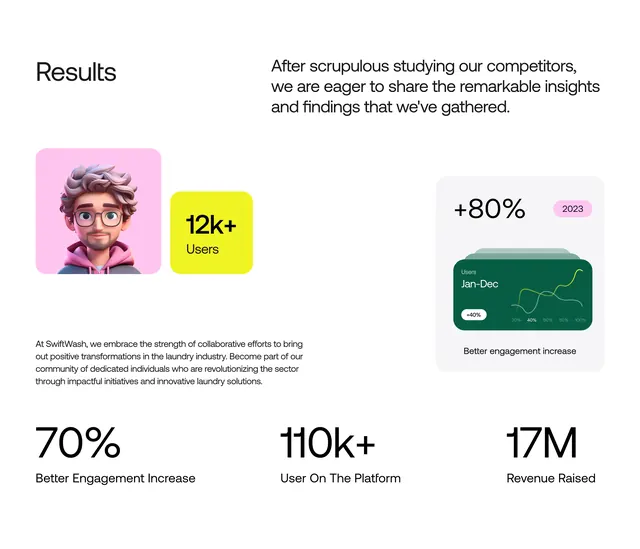 Infographic corporate-clean infographic
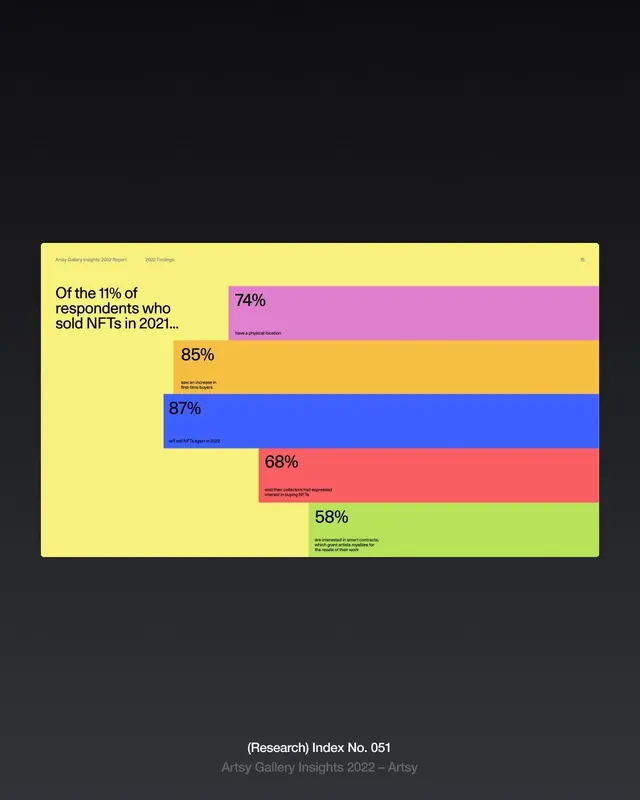 Infographic data-dense infographic
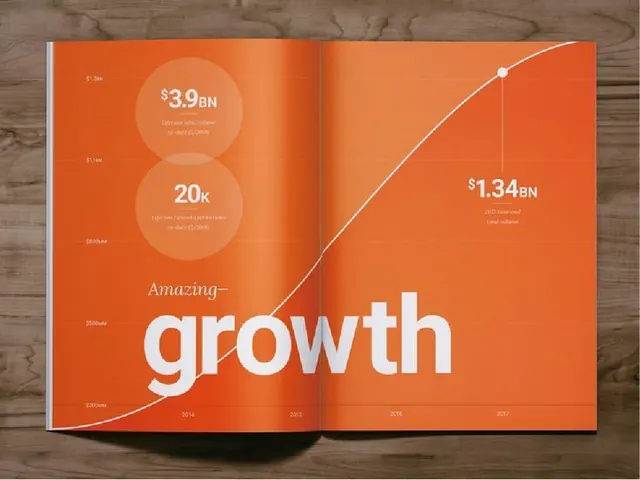 Data-dense minimal infographic
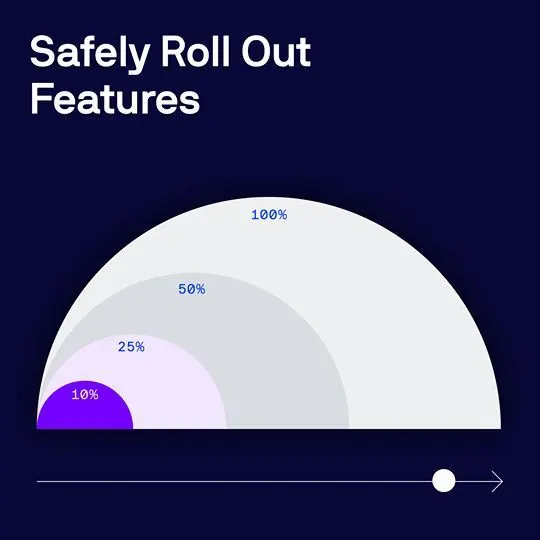 Minimal data-dense infographic
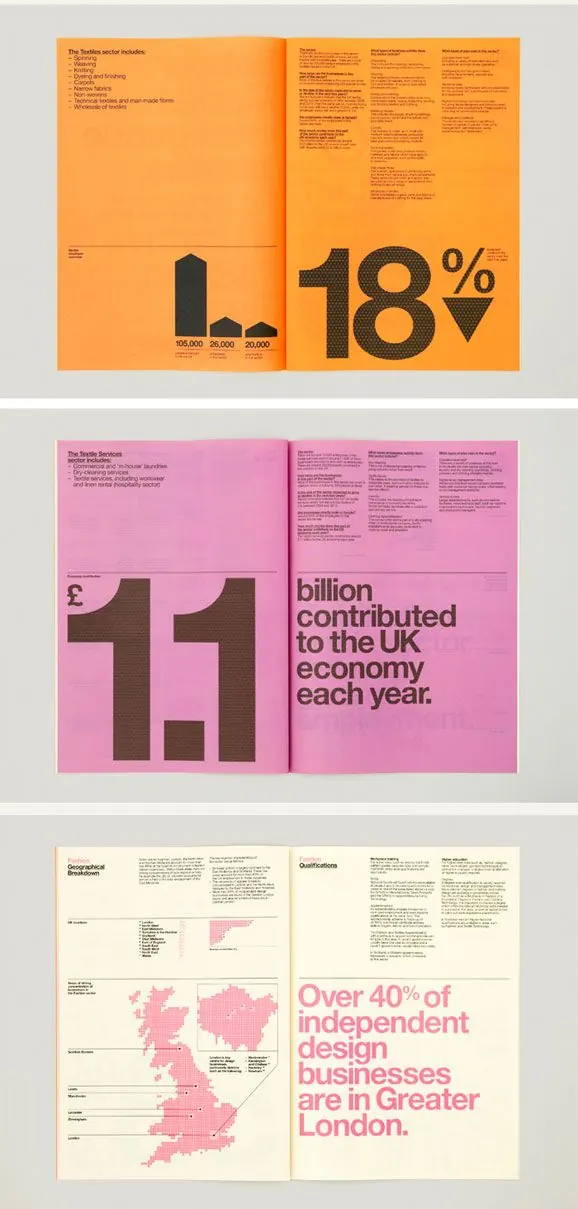 Infographic data-dense infographic
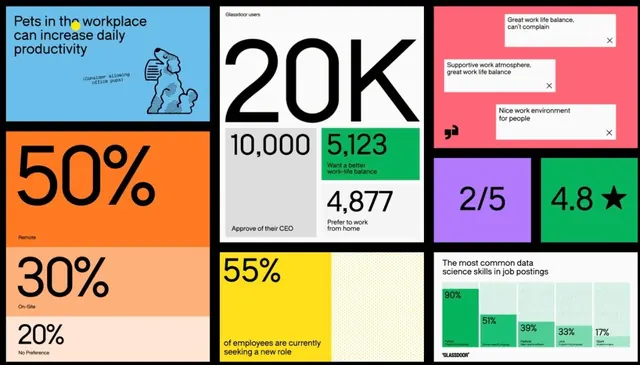 Glassdoor workplace stats bento infographic
 Topographic map visualization with gold-leaf texturing (slide 1)
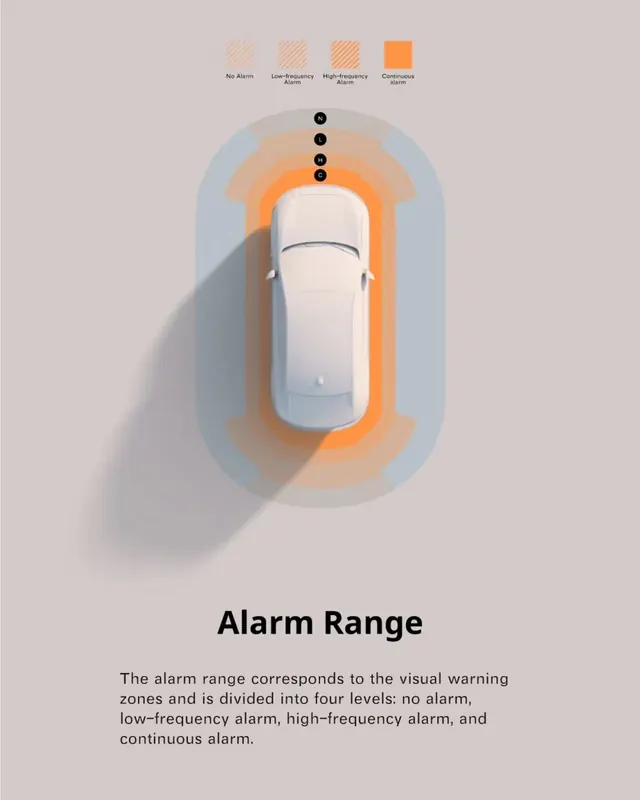 Minimal infographic infographic
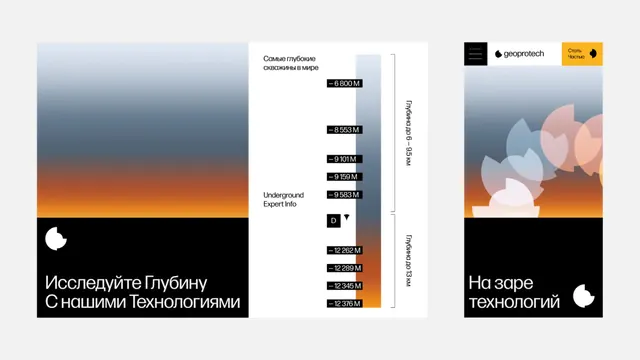 Infographic gradient-heavy infographic
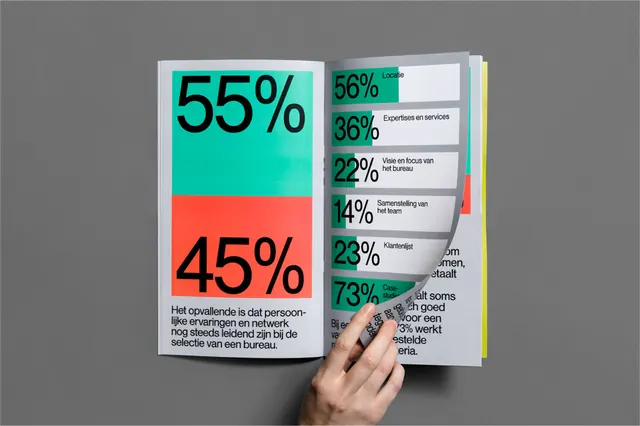 Infographic data-dense infographic
 Google Stadia gradient ribbon mark
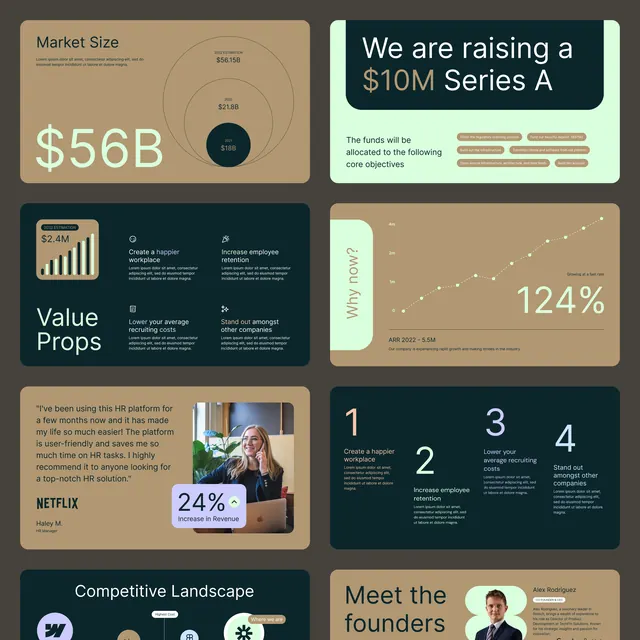 Infographic corporate-clean infographic
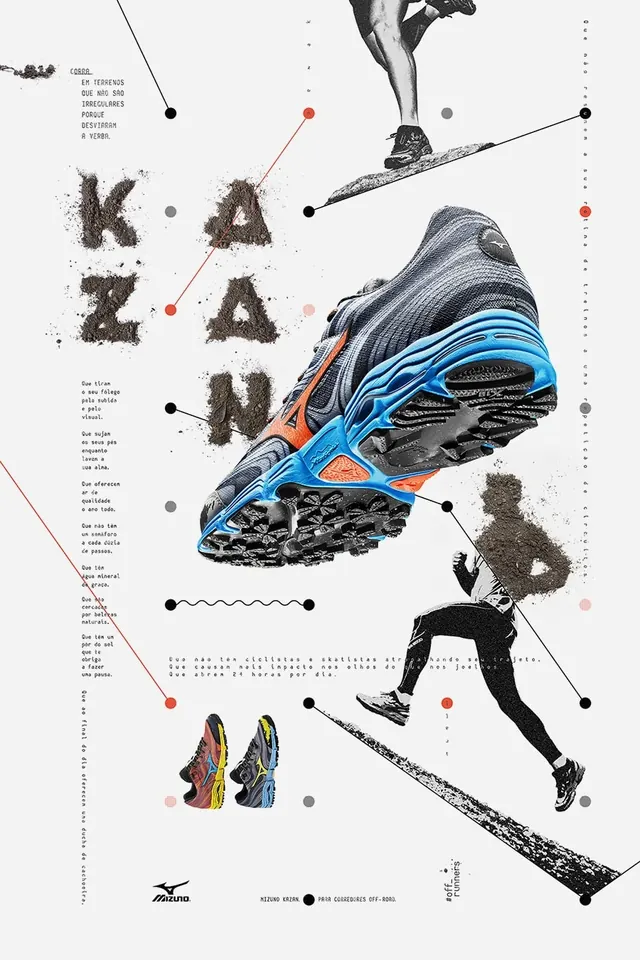 Running shoe product infographic
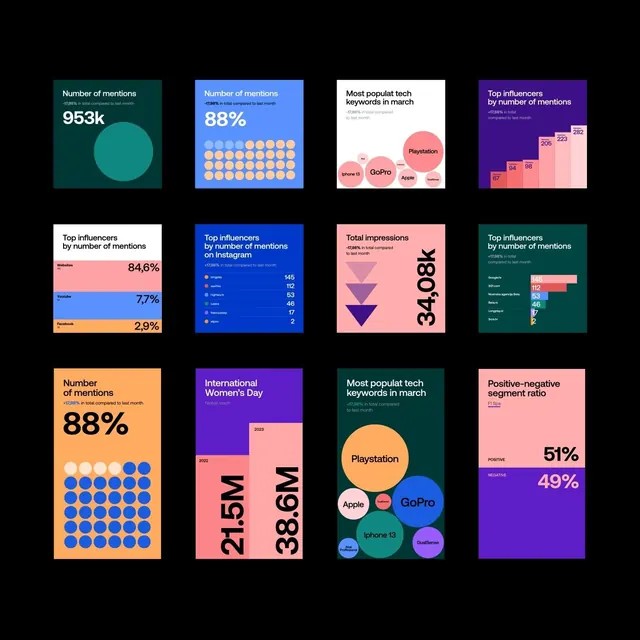 Data-dense infographic infographic