Global network data visualization
3D globe visualization with layered grid lines and glowing network connection points, showing data flow across continental regions.

Summary
A 3D rendered globe with glowing network points and connecting lines, overlaid with a grid showing data clusters concentrated in Europe and surrounding regions, visualizing global connectivity or data distribution.
Visual description
A dark navy-to-black background hosts a semi-transparent globe with a white grid overlay. Major cities or data nodes glow in amber-orange and bright magenta, connected by lines showing network paths. The visualization is layered—a white latitude/longitude grid sits atop the globe, while glowing nodes and connection paths suggest active data flow or network activity across continents.
Key takeaway
Layered transparency and selective glow on data points makes complex spatial information readable without clutter. The grid creates structure while color and brightness direct attention to key nodes.
Reuse notes
Strong reference for fintech, analytics, or infrastructure SaaS companies communicating global scale or data connectivity. Works well for dashboards or investor presentations.
More like this
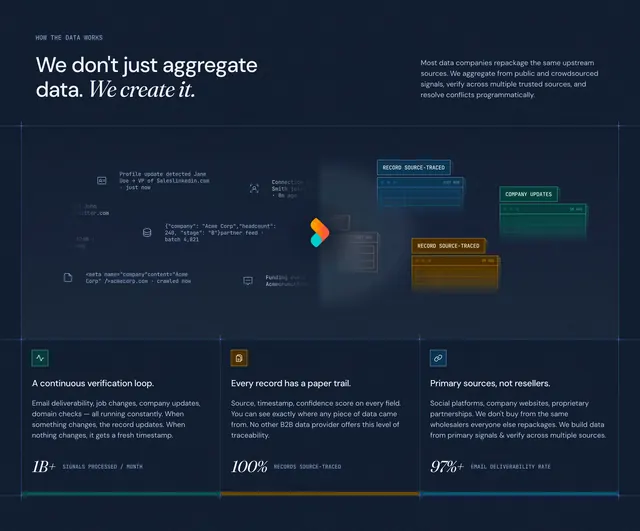 RevenueBase how-the-data-works value section
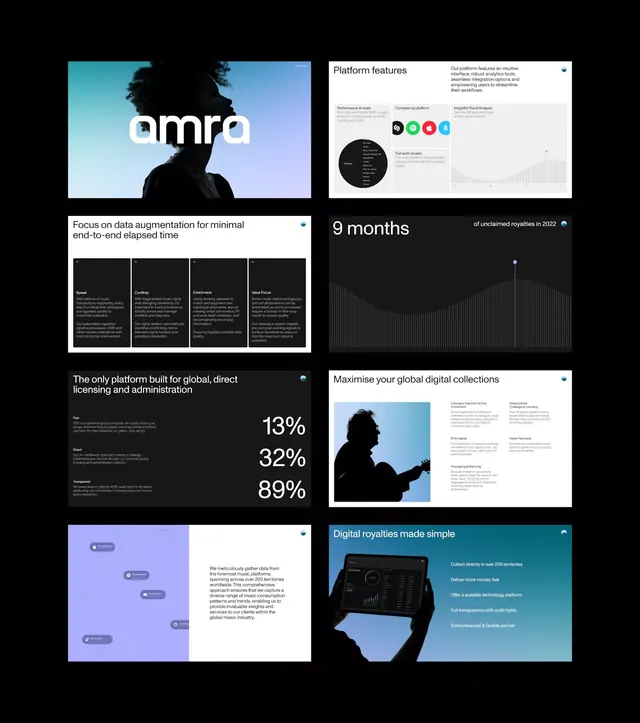 Multi-slide fintech platform deck with data visualizations
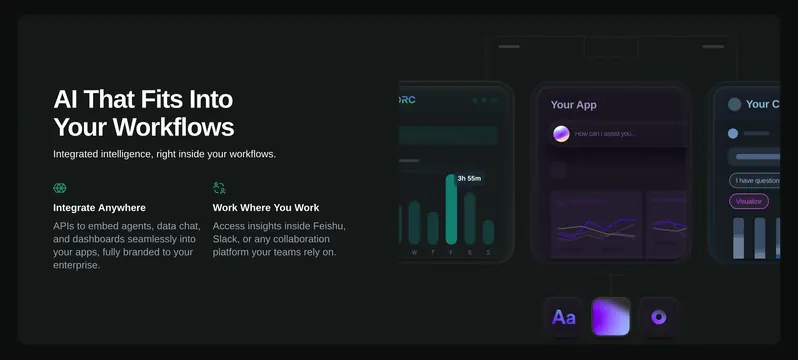 ReOrc AI workflow integration feature
- Technical data-dense data viz
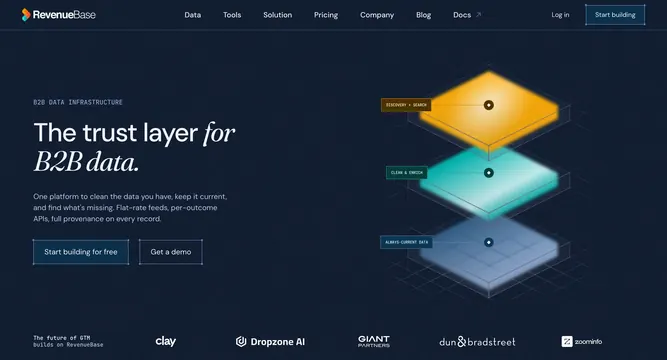 RevenueBase B2B data infrastructure hero
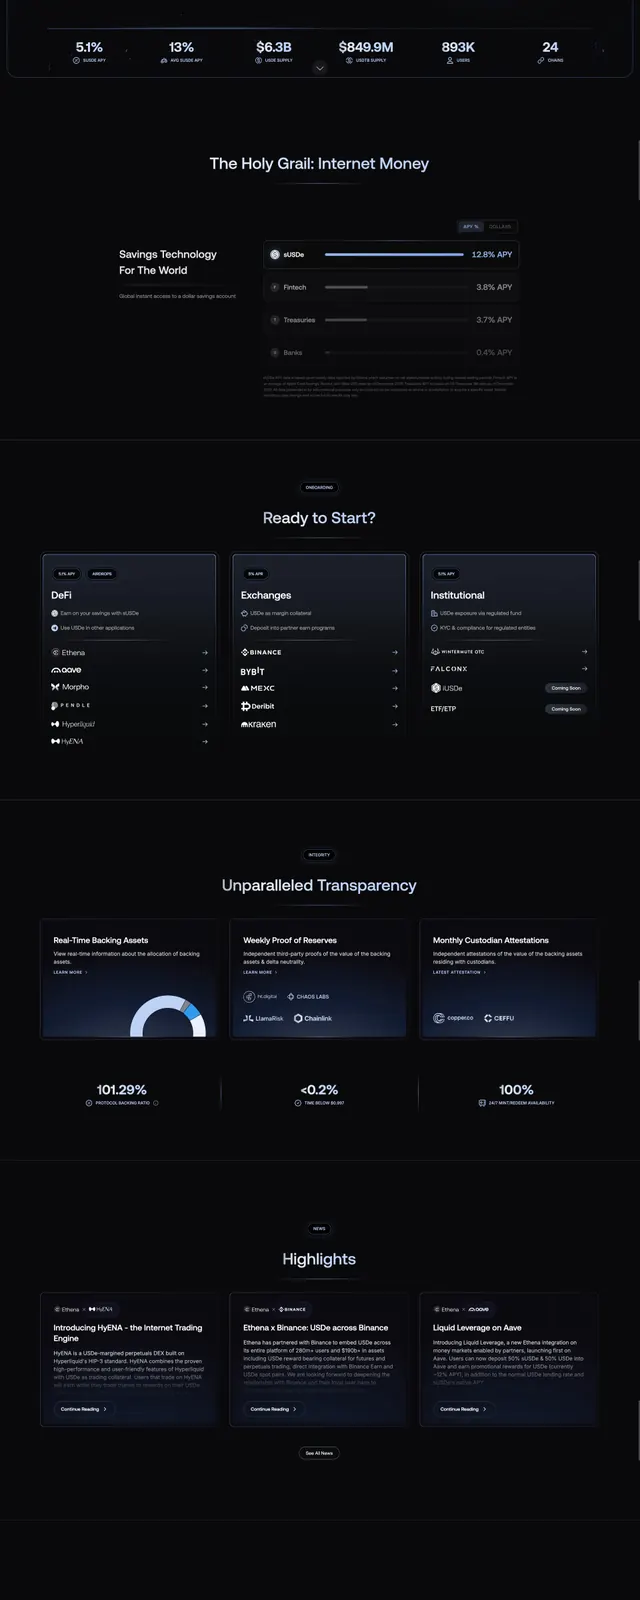 Ethena Dark Finance Landing Page
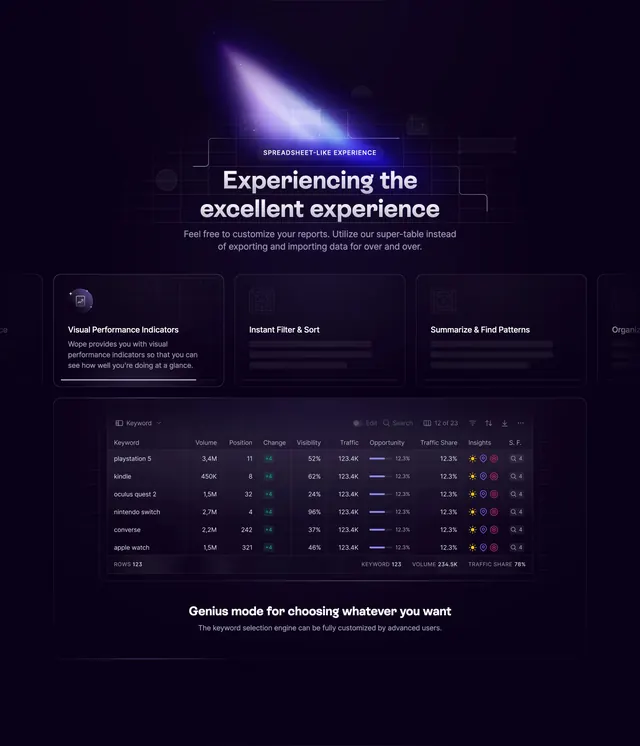 Wope spreadsheet-like reporting feature
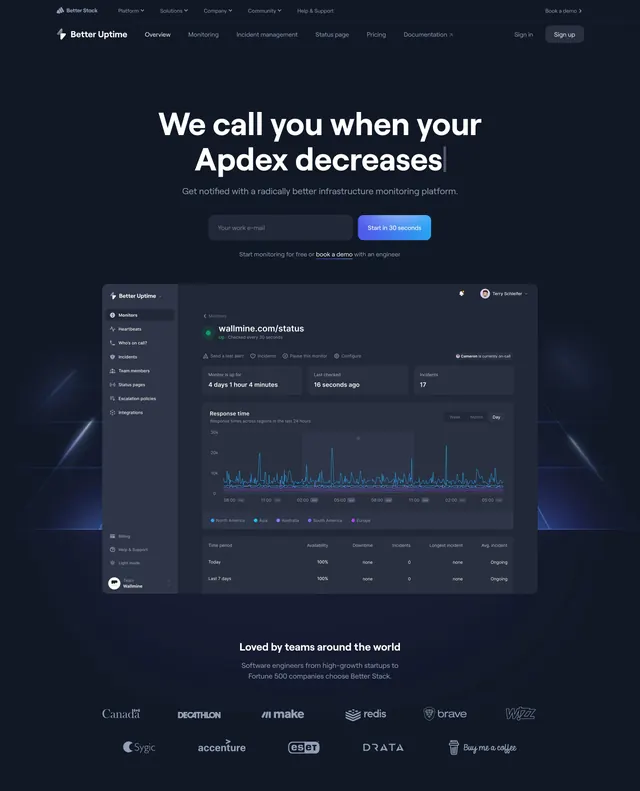 Better Uptime centered hero with dashboard
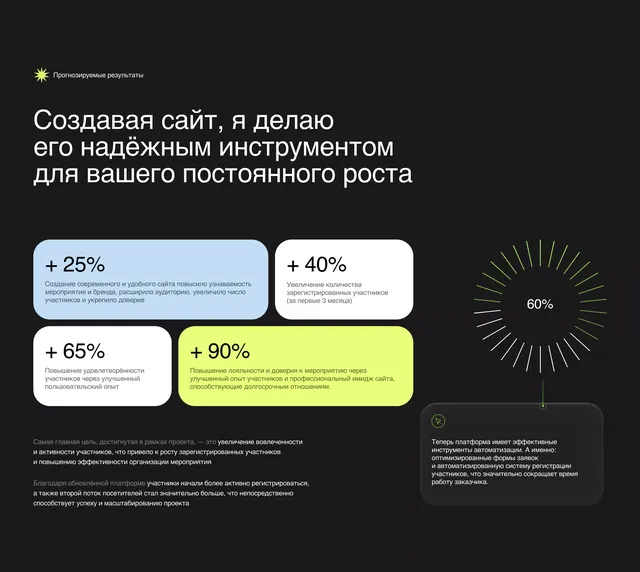 Dark dashboard with neon metric cards and circular gauge
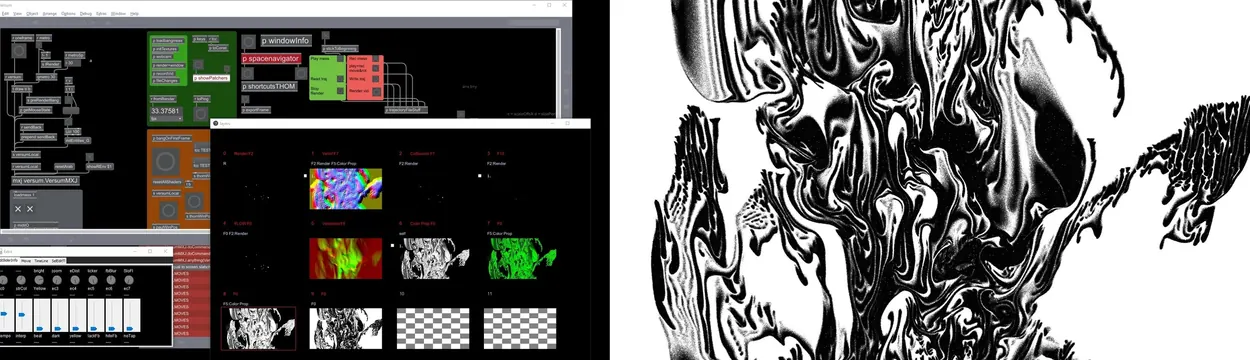 Data Visualization and Abstract Fluidity Design
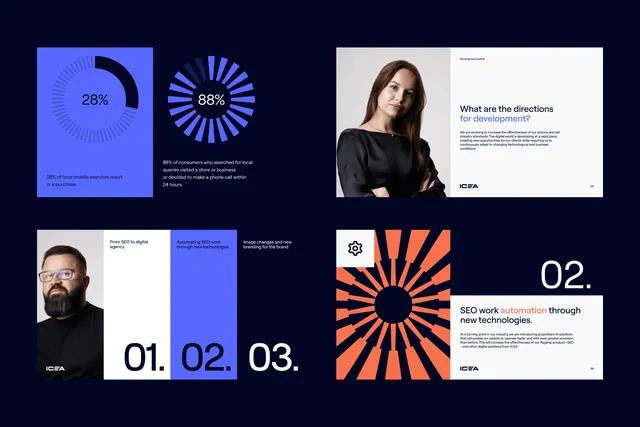 Minimal geometric data viz
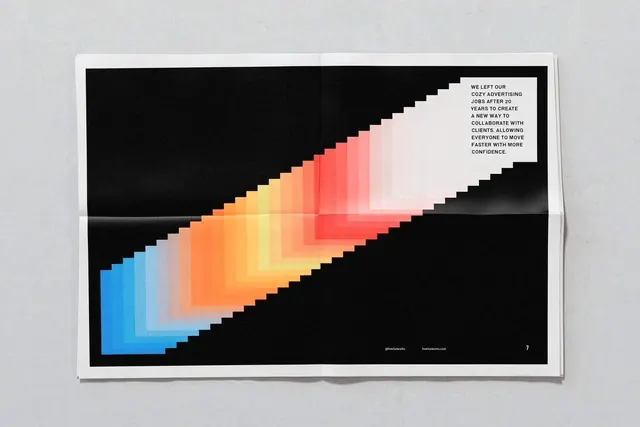 Data-dense minimal data viz
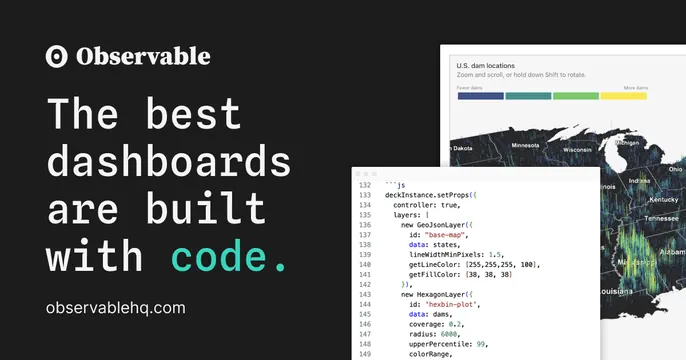 Observable OG card
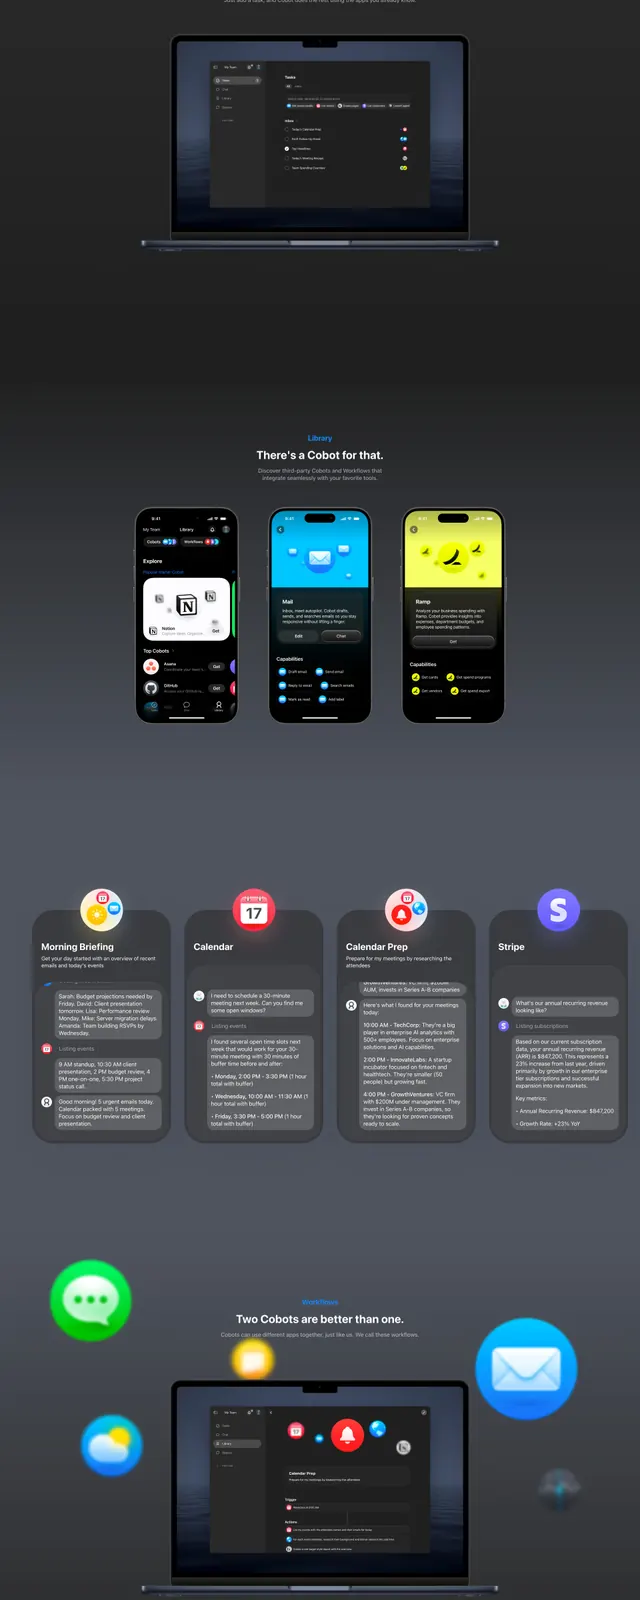 Dark Cobot Product Launch
 GitHub Copilot agent mode hero
 3D isometric cityscape with neon red and cool blue lighting
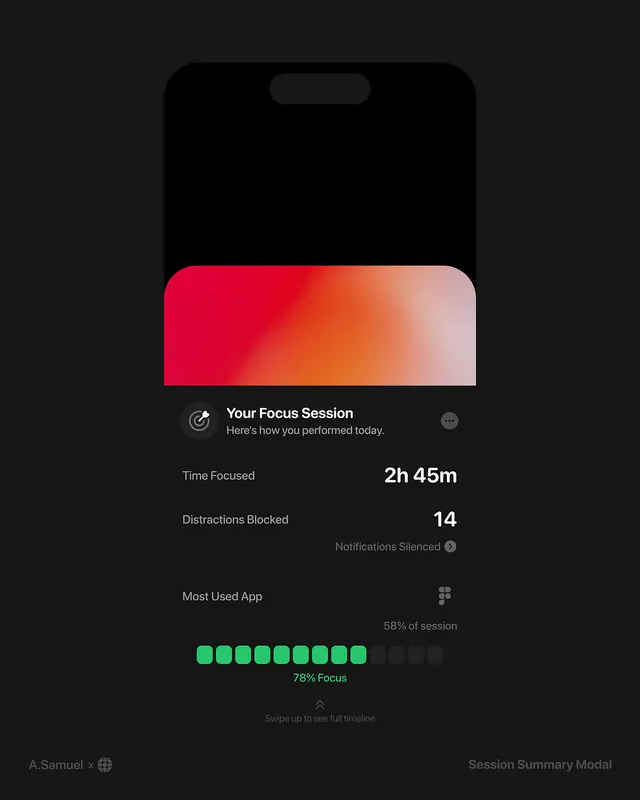 Dark-mode gradient-heavy data viz
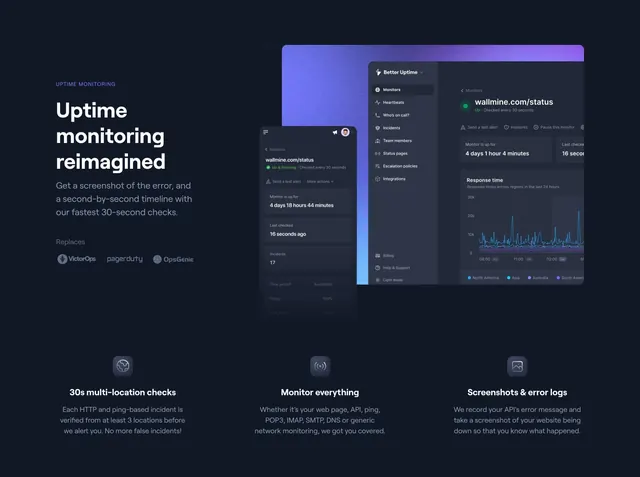 Better Uptime monitoring reimagined showcase
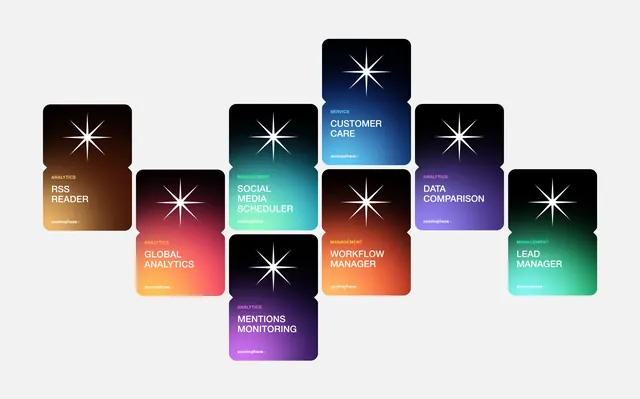 Dark-mode minimal data viz
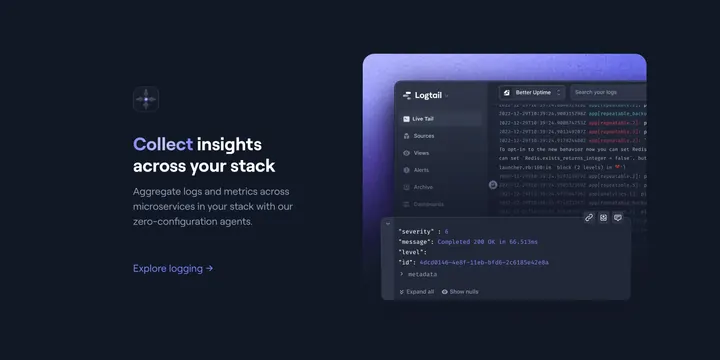 Better Stack Logtail logging split feature
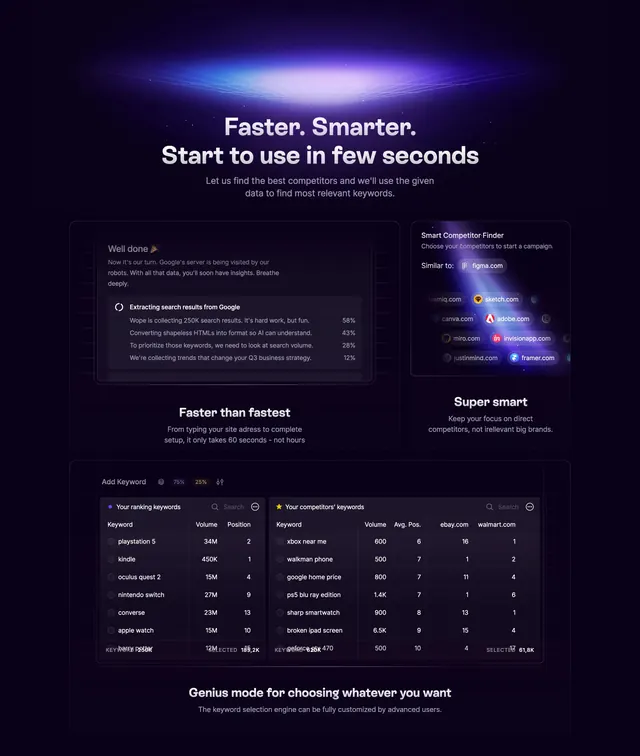 Wope onboarding features grid
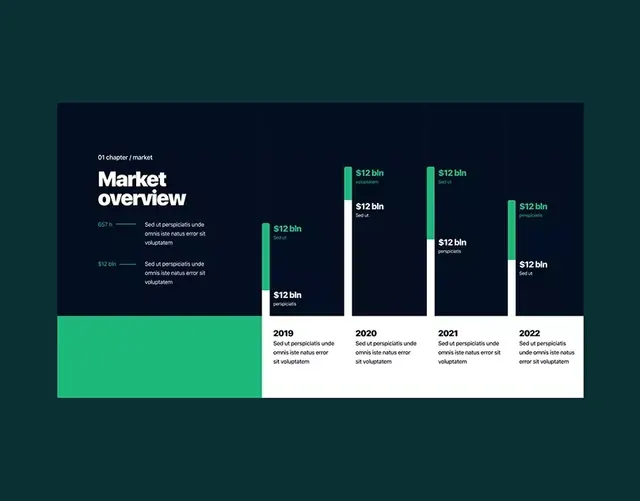 Market overview financial data dashboard
 Dark-mode technical data viz
 HUD interface with hand gesture