MVP Comparison Infographic
A visual guide comparing incorrect and correct ways to build a Minimum Viable Product using simple line-art illustrations.

Summary
A visual guide comparing incorrect and correct ways to build a Minimum Viable Product using simple line-art illustrations.
Visual description
A yellow background features black line-art icons of faces, glasses, a car, and a motorcycle. The top section shows 'NOT LIKE THIS' with complex items, while the bottom shows 'LIKE THIS' with simplified versions.
Key takeaway
Visualizes the concept of simplifying features to reach a viable product quickly.
Reuse notes
Use as a slide in a product strategy presentation or a social media educational post.
TypeSans Serif, All Caps
IndustryMarketing, Productivity, Saas
Tagscomparison, educational, mvp, product design, minimalist
Palette
#FAD282
#120E09
More like this
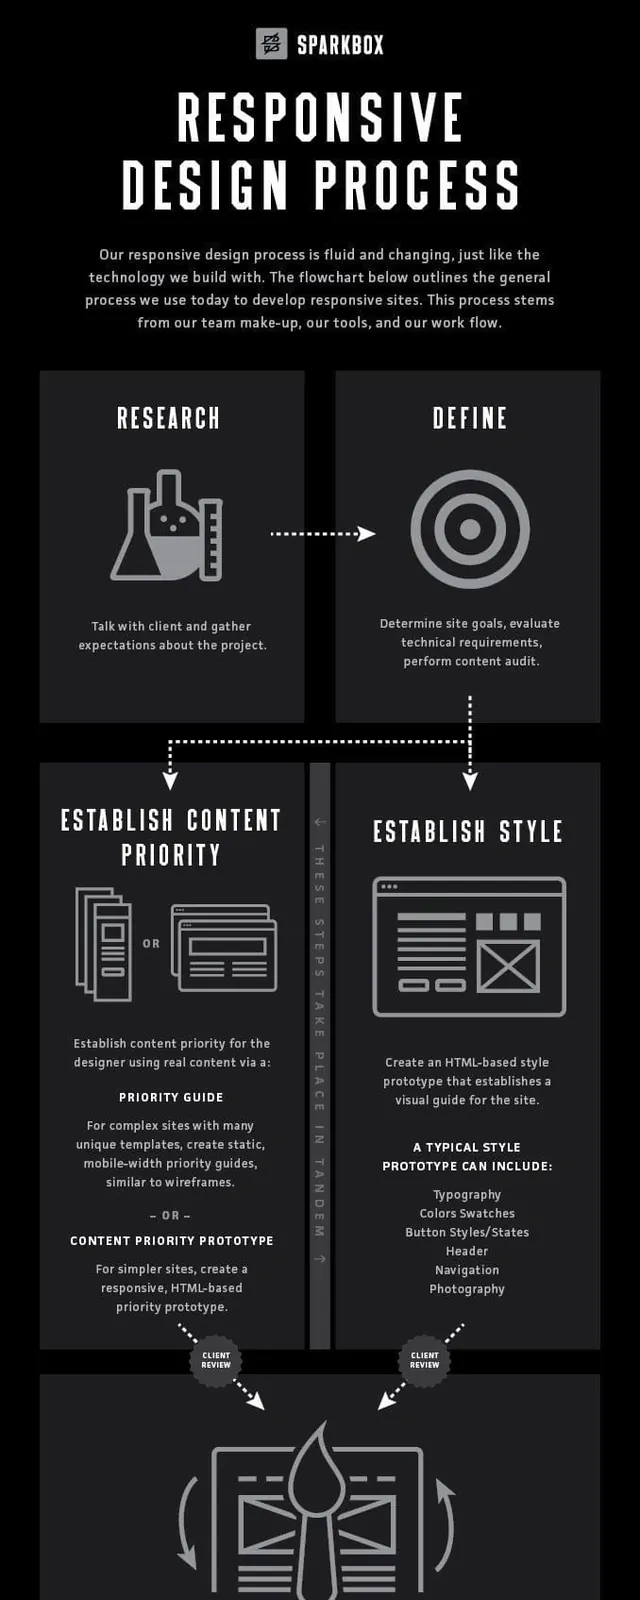 Responsive Design Process Infographic
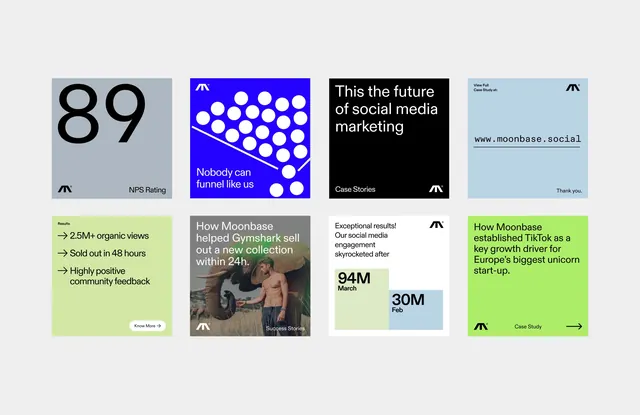 Minimal data-dense infographic
 How to Listen Instructional Graphic
 Minimal corporate-clean infographic
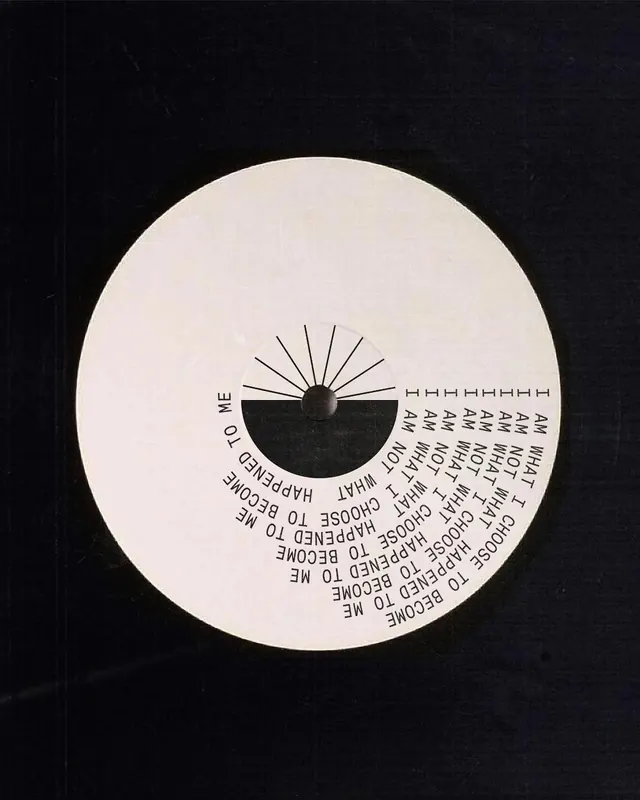 Circular sun clock infographic
 Laundry Care Instruction Graphic
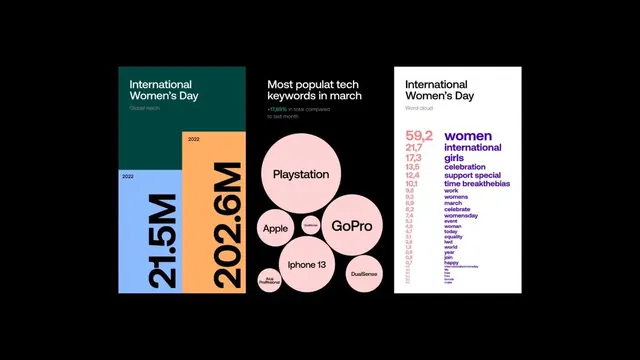 Flat infographic infographic
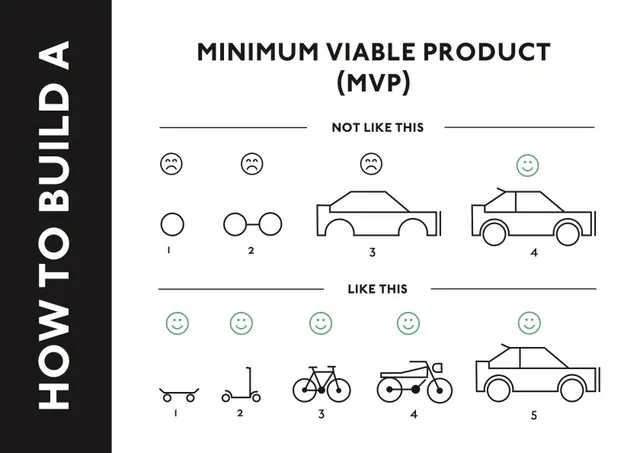 Minimum Viable Product (MVP) Comparison Infographic
 Data-dense dark-mode infographic
 Tinker color palette specification guide
 Infographic minimal infographic
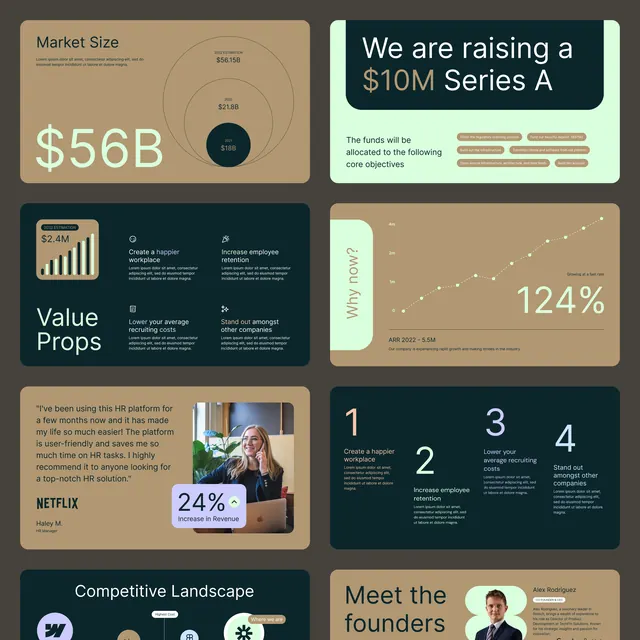 Infographic corporate-clean infographic
 Infographic minimal infographic
 Minimal data-dense data viz
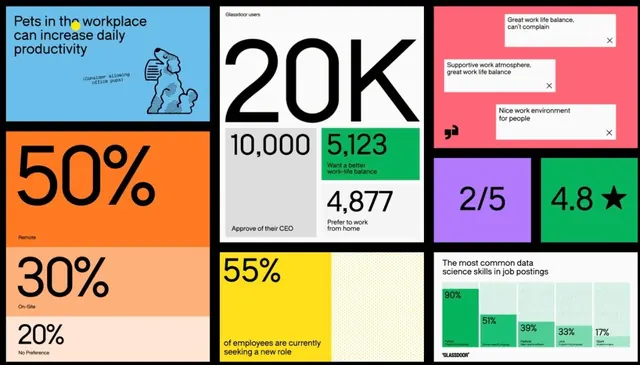 Glassdoor workplace stats bento infographic
 Minimal corporate-clean infographic
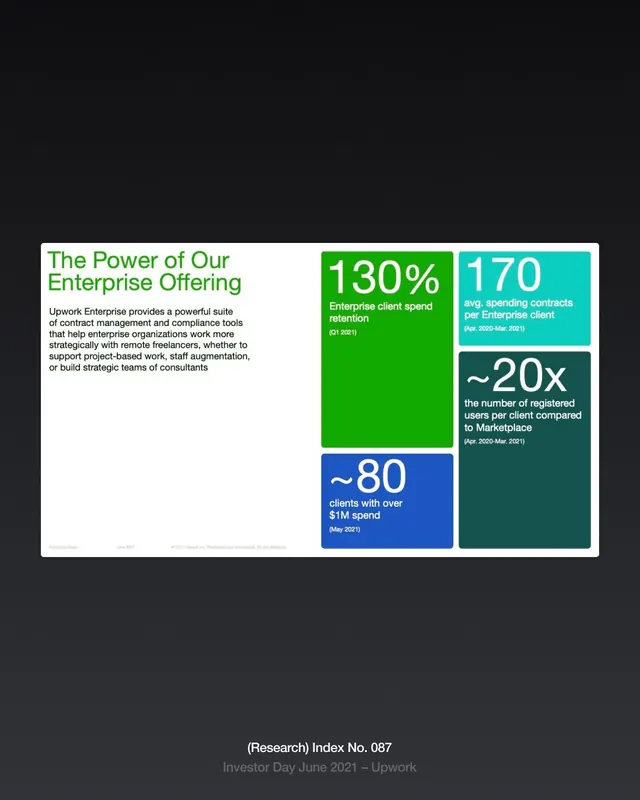 Data-dense infographic infographic
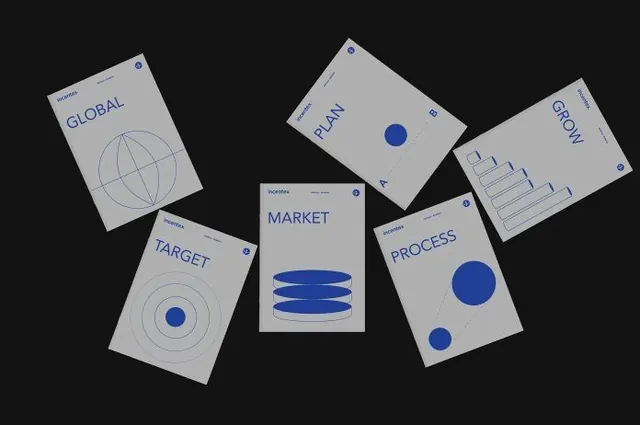 Minimal flat infographic
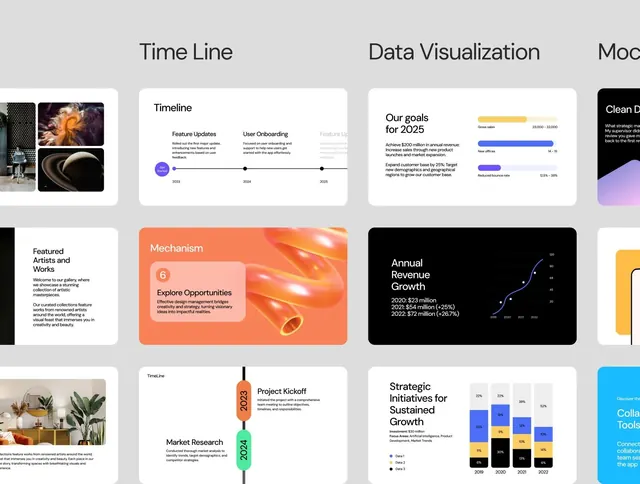 Minimal corporate-clean infographic
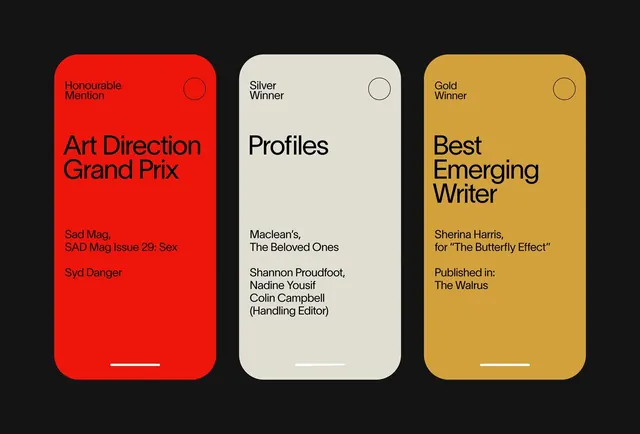 Magazine awards layout with color blocks
 Infographic minimal infographic
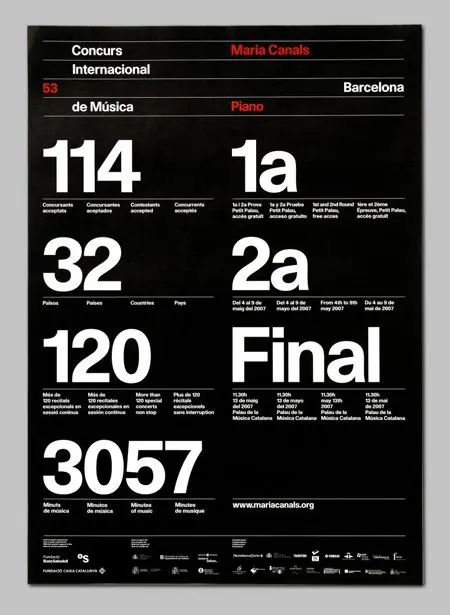 Concerts Internationaux Piano Scoreboard
 EQUAL EQL Wordmark
 Data-dense infographic infographic