Strange attractor mathematical visualization
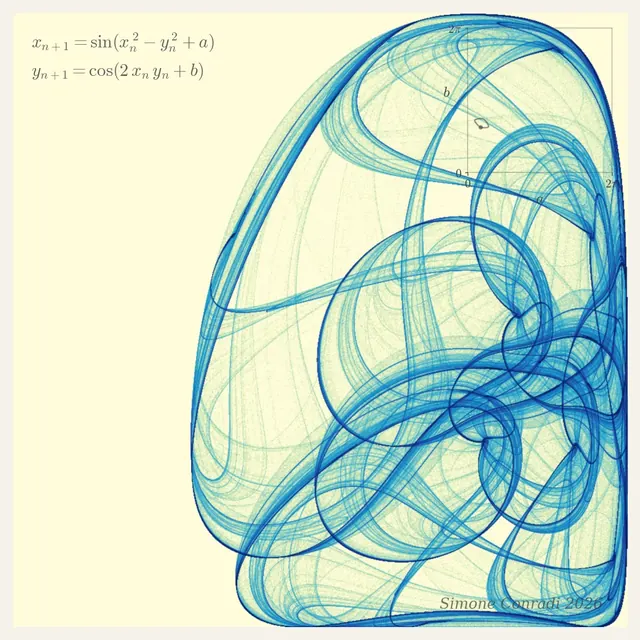
Educational animation visualizing a strange attractor pattern generated by iterative mathematical formulas, rendered with flowing blue curves against a cream background, paired with the generative equations and artist signature.
Summary
A visual explanation of a strange attractor-a mathematical concept where iterative application of a simple formula creates complex, self-similar patterns. The piece shows flowing blue curves against a warm cream background, accompanied by the generative equations and the artist's signature, presenting abstract mathematics as visual art.
Visual description
The composition is divided into two zones: the left side presents the mathematical formulas in serif monospace type (xₙ₊₁ = sin(xₙ² − yₙ² + a) and yₙ₊₁ = cos(2·xₙ·yₙ + b)), rendered in dark text against the cream ground. The right and lower portions showcase an intricate flowing pattern of blue curves ranging from pale teal to deep cobalt, organized into an organic bounding shape resembling a seed or teardrop. The curves layer and overlap with gridded reference lines, suggesting mathematical plotting. The artist's name "Simone Conradi 2026" appears handwritten in smaller script at the lower right. The overall effect bridges computational abstraction and organic visual beauty, suggesting emergence and order hidden within seemingly random iteration.
Key takeaway
Transforming abstract mathematics into a visually compelling, gallery-worthy image makes complex concepts accessible and aesthetically compelling. The pairing of visible equations with the visual result creates educational narrative without text explanation. The choice to render the pattern in soft blue against warm cream balances technical rigor with visual approachability, making it suitable for both academic and art contexts.
Reuse notes
Excellent for educational content, science communication, and art-meets-mathematics contexts. The approach works well for visualizing any generative or algorithmic process. Effective for STEM education, data visualization, and contemporary generative art. The warm-cream-and-cool-blue palette is calming and sophisticated. Can be adapted for visualizing other mathematical phenomena, chaos theory, fractals, or algorithm-driven design.
More like this
 Geometric abstract data viz
 Abstract minimal data viz
 Gradient-heavy abstract data viz
 Minimal gradient-heavy data viz
 Minimal gradient-heavy data viz
 Geometric minimal data viz
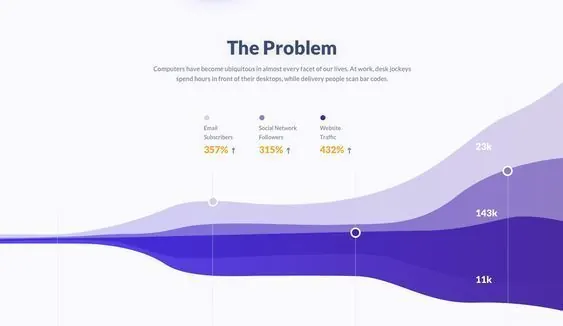 Minimal data-dense data viz
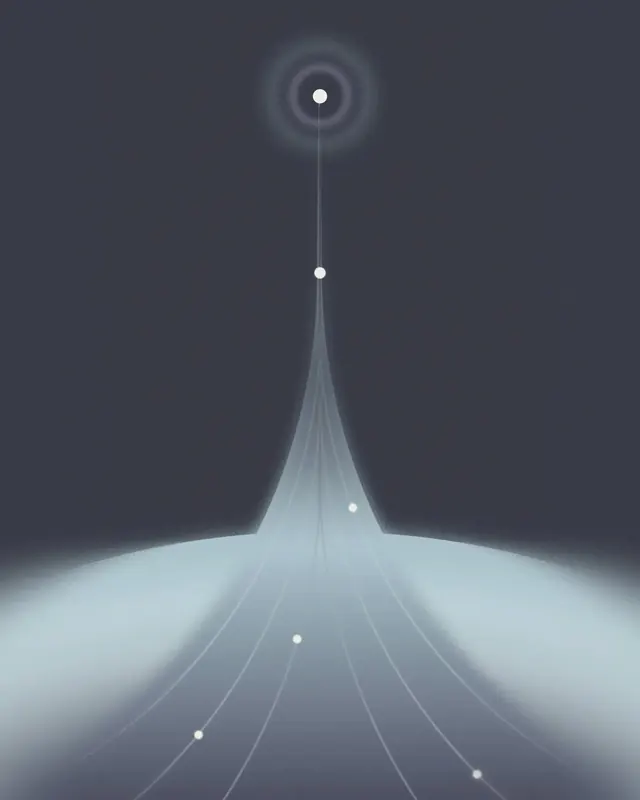 Minimal abstract data viz
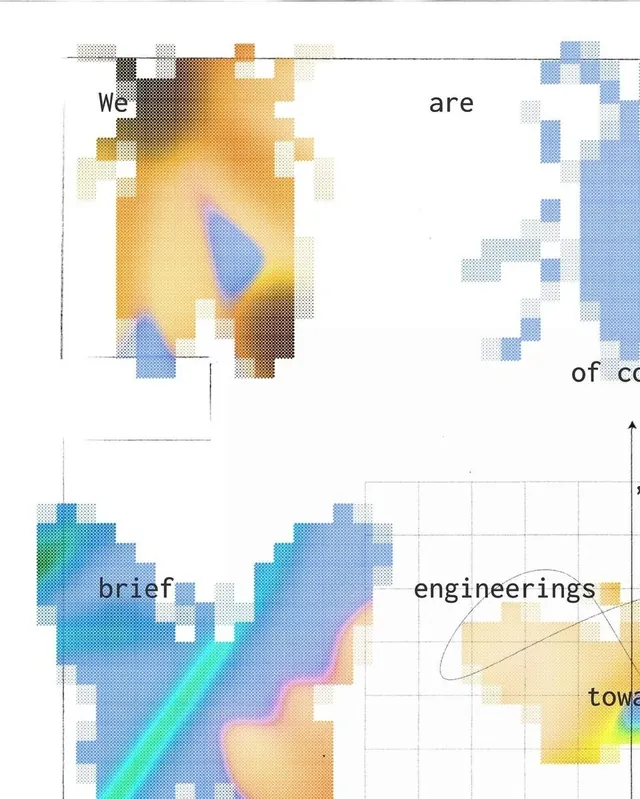 Abstract gradient-heavy data viz
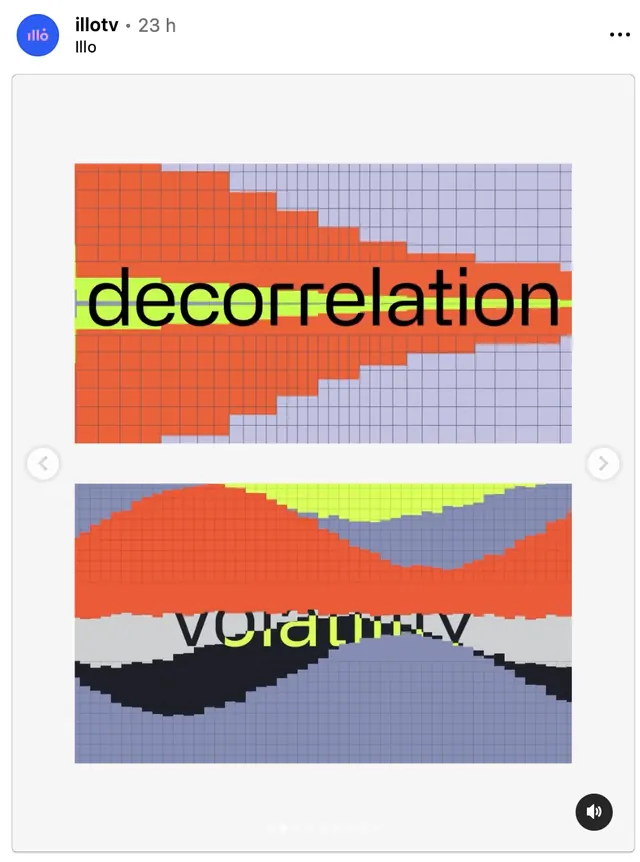 Data-dense minimal data viz
 Gradient-heavy abstract data viz
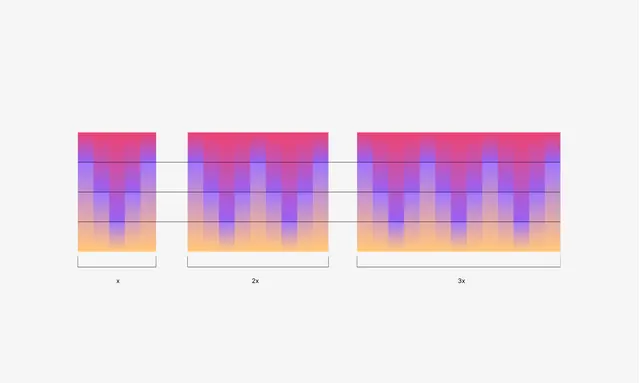 Gradient-heavy minimal data viz
 Cinema 4D generative 3D form experiments (slide 4)
 IBM simulation 3D motion graphics carousel (slide 2)
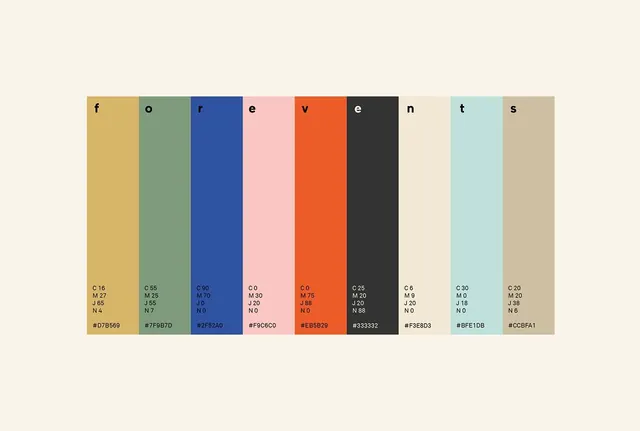 Minimal gradient-heavy data viz
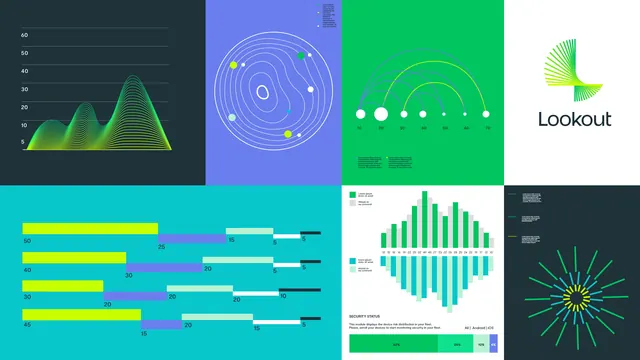 Minimal gradient-heavy data viz
 Topographic map visualization with gold-leaf texturing (slide 1)
 GPT-5.2-Codex centered title with code-fragment haze
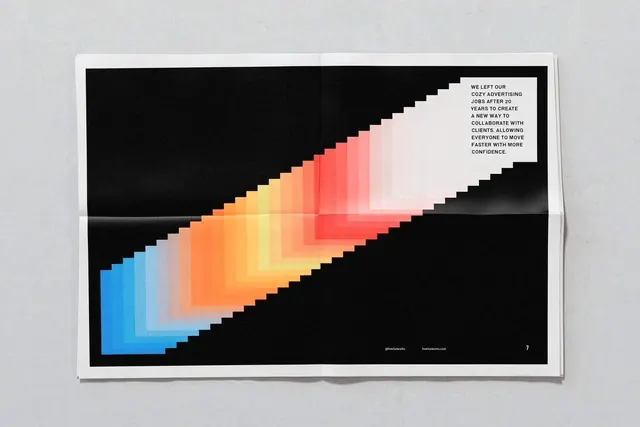 Data-dense minimal data viz
 Minimal geometric ui screen
 Gradient circle studies motion design
 Geometric abstract data viz
 Minimal geometric data viz
 Technical abstract data viz