Float cannabis grid spectrum chart
Educational data visualization showing a grid of cannabis strain indicators labeled FLOAT with spectrum ranging from HIGH to LOW potency.

Summary
An educational infographic displaying a grid-based data visualization of cannabis strain characteristics labeled FLOAT, with potency indicators and a spectrum scale from HIGH to LOW.
Visual description
Warm red-orange textured background with a person's shoulder and hair visible at bottom right. Large white sans-serif heading "FLOAT" positioned at top center. Below, a grid of three-letter/number codes arranged in rows (THC, A1, B2, C3, D4, E5, F6, CBD across top; G1, H2, I3, J4, K5, L6 in second row; M1, N2, O3, P4, Q5, R6 in third row; S1, T2, U3, V4, W5, X6 in fourth row). Individual cells are in monospace typography, with one cell (W5) highlighted with a border. Below the grid, "HIGH" appears on the left and "LOW" on the right, suggesting a potency spectrum. The layout is systematic and technical, resembling a periodic table or seating chart. The data visualization method communicates complex product information in an organized, readable format.
Key takeaway
Grid-based layouts organize complex data efficiently while maintaining visual clarity. The periodic table approach to product information creates familiarity and professionalism. Monospace typography emphasizes the technical, data-driven nature of the content. The spectrum indicator communicates product characteristics systematically.
Reuse notes
Effective template for product information, educational content, or technical data visualization in cannabis, supplements, or pharmaceutical contexts. The grid approach scales well for showing relationships between variables or products. Suitable for strain selection tools, product comparisons, or medical/educational resources. The professional grid layout legitimizes the information and builds trust for regulatory or medical contexts.
More like this
 Boeing 747-400 red typographic spec poster
 Hand anatomy measurement diagram
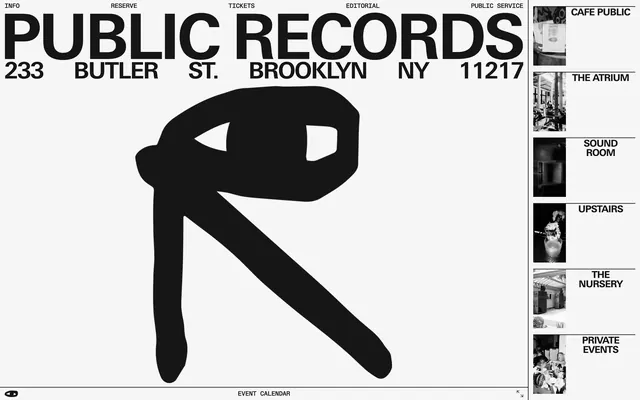 Information-dense wayfinding and layout system
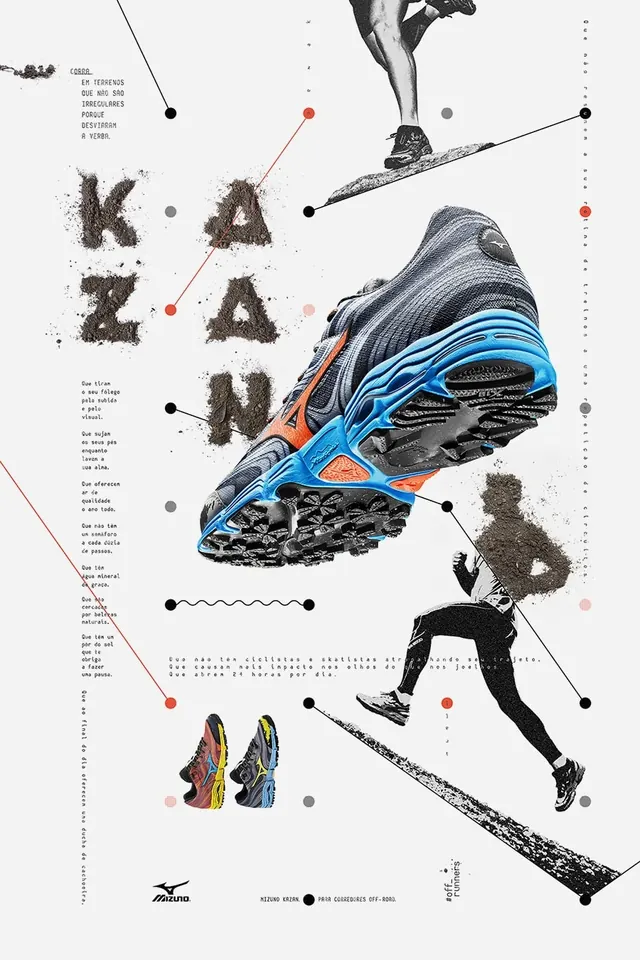 Running shoe product infographic
 Ferrari F154 Engine Specification Poster
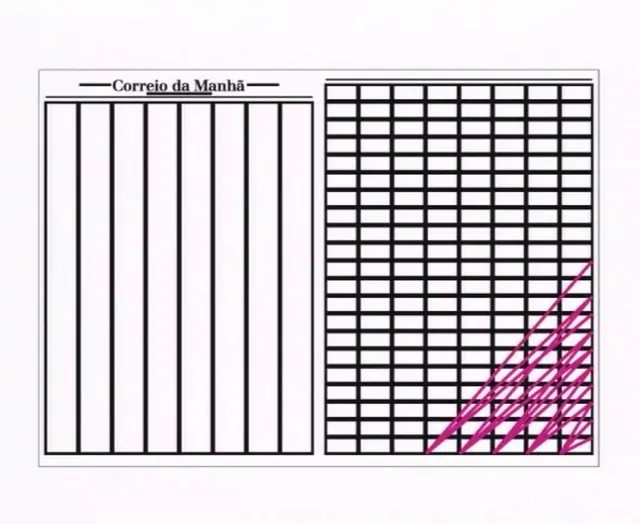 Newspaper visualization chart with grid and diagonal hatching
 Infographic data-dense infographic
 German design history typographic map
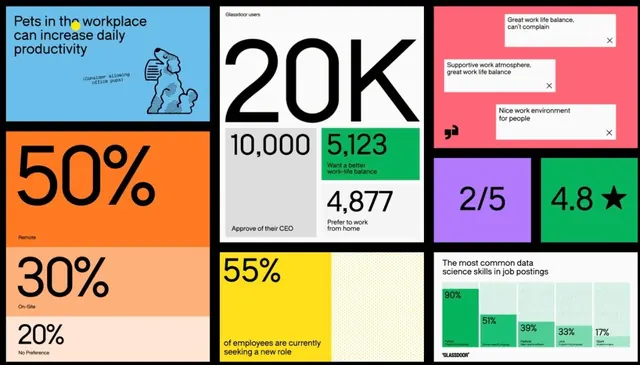 Glassdoor workplace stats bento infographic
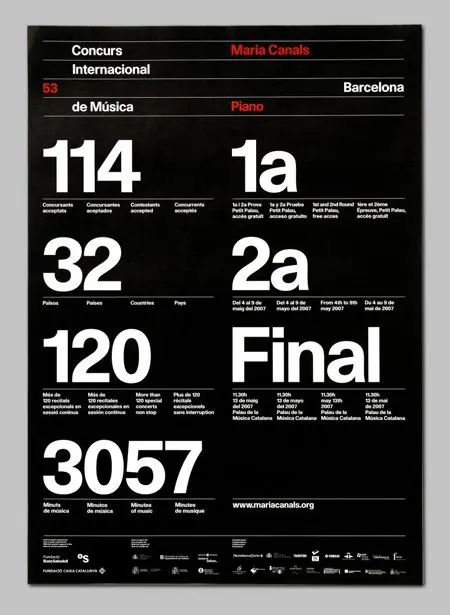 Concerts Internationaux Piano Scoreboard
 Minimal data-dense data viz
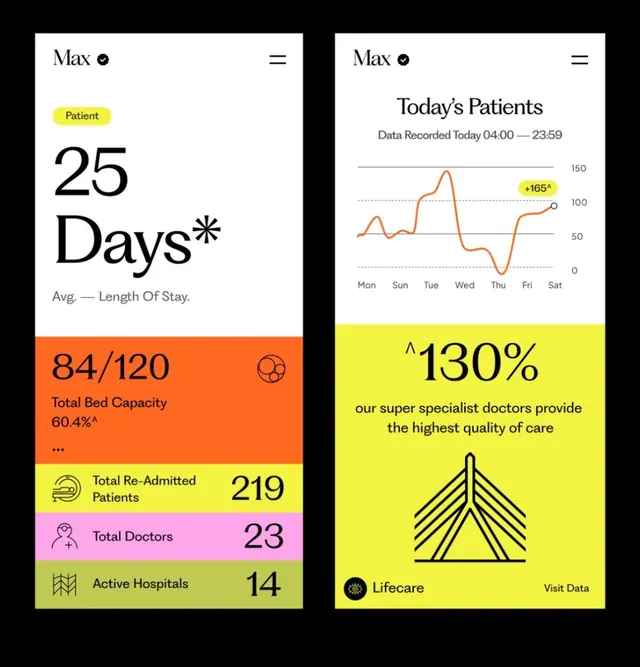 Data-dense minimal infographic
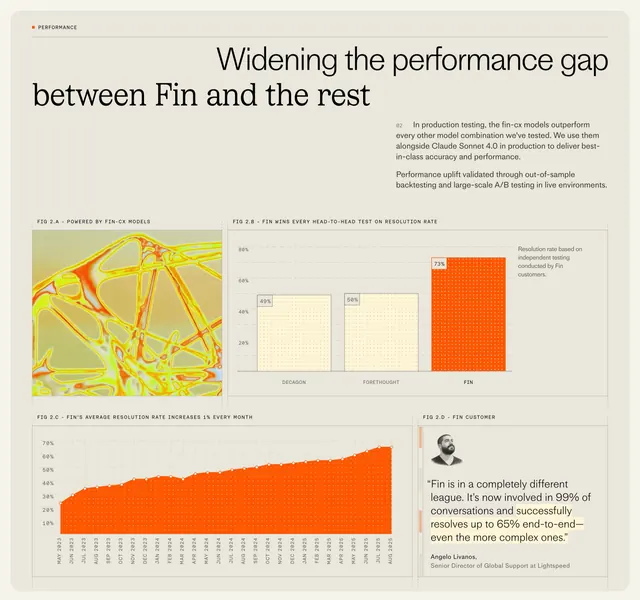 Fin CX model performance data grid
 Year 1982 information design with cultural references
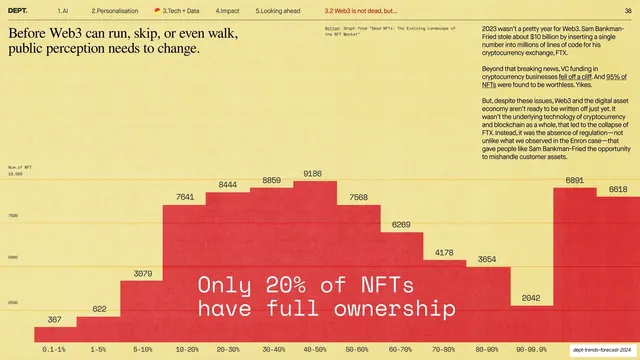 NFT ownership stepped bar chart
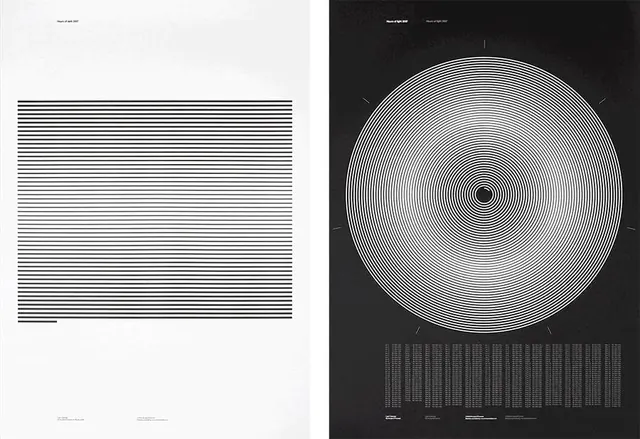 Linear patterns and circular concentric design
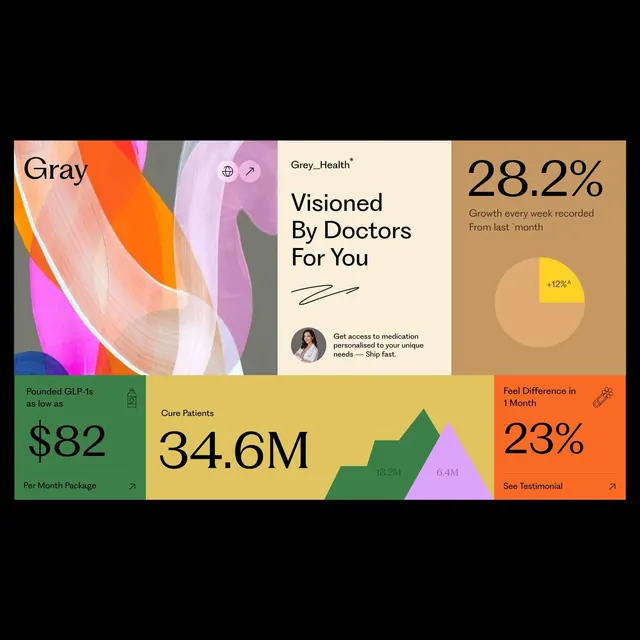 Infographic data-dense infographic
 Sustainable product showcase layout with grid
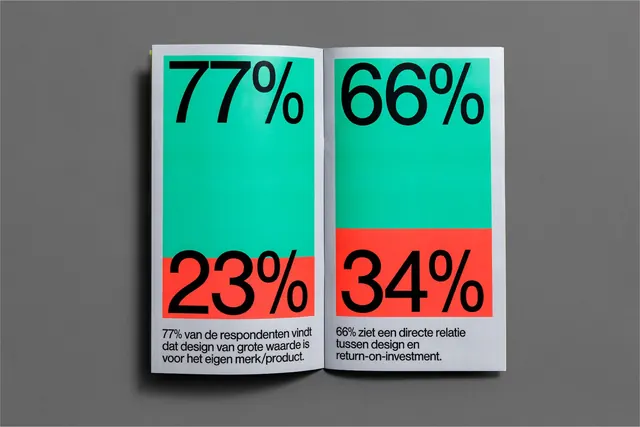 Infographic data-dense infographic
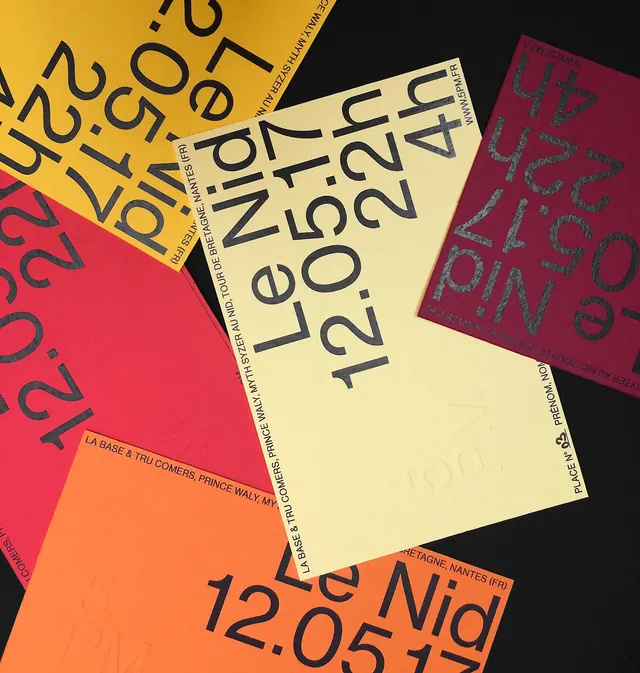 Data-dense geometric data viz
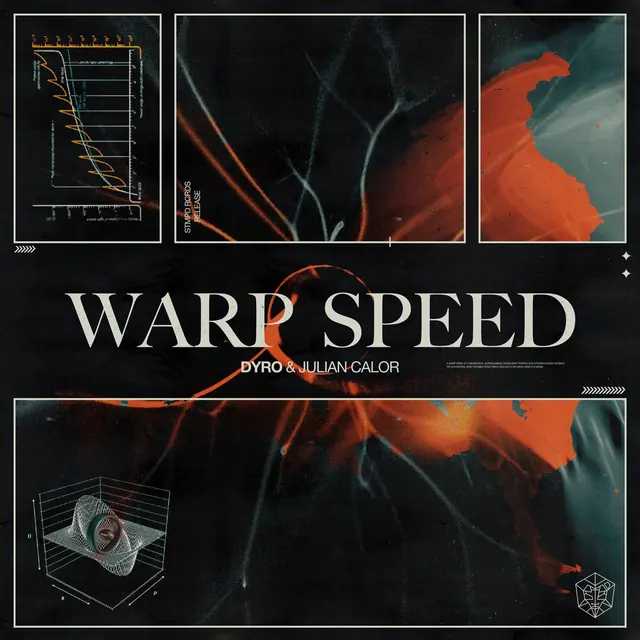 WARP SPEED Album Cover
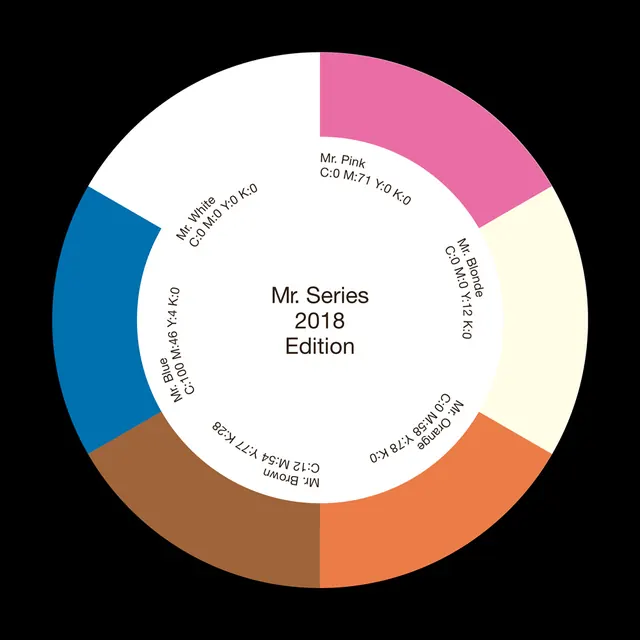 Data-dense infographic infographic
 Data visualization - figure with information streams
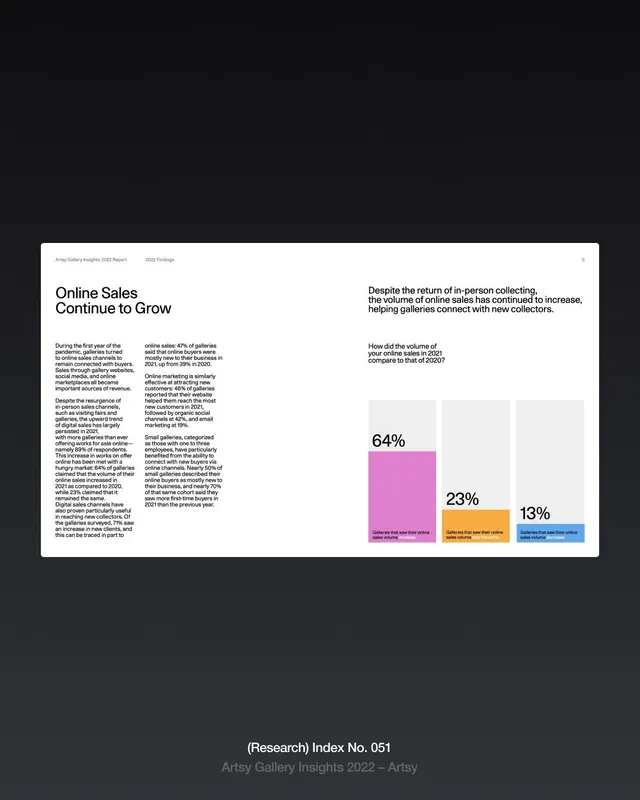 Minimal editorial infographic