7Analytics tablet slide and book on white
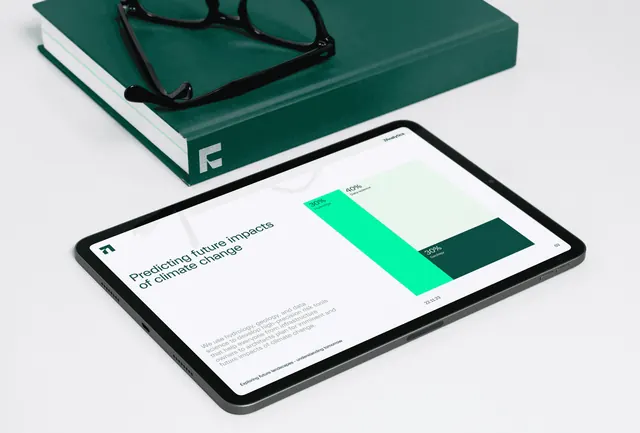
Staged product photo of a tablet showing a light presentation slide with a proportional green block chart, beside a dark green book stamped with the mark.
Summary
A light-mode presentation slide shown on a tablet, where the data is expressed as three flat colour blocks rather than a conventional chart.
Visual description
Shot from a raised angle on a plain white surface. Top left, a dark green hardback book lies flat with a pair of black eyeglasses resting on it; the book's spine face carries the 7Analytics mark in white. Below and to the right, a dark grey tablet in landscape shows a slide on a near-white ground. Left half of the slide: the mark in the top corner, a two-line headline in dark green reading "Predicting future impacts of climate change", and a grey paragraph lower down explaining the use of hydrology, geology and data science; a small line of running copy and a footer caption sit under it. Right half: three rectangles sized to their share of the whole, a tall bright mint block labelled "30% Hydrology", a taller pale mint block labelled "40% Data science", and a shorter dark green block labelled "30% Geology" overlapping the lower right. Percentages are set large, category names small underneath. A date and a page number sit at the margins.
Key takeaway
The chart is just three filled rectangles proportioned to their values, labelled in place, and it reads faster than a pie or a bar axis would. The three-step green scale, bright, pale, dark, gives a fully monochrome data language without introducing a second hue.
Reuse notes
Useful for report covers, pitch decks and any brand that must show data without looking like a dashboard. Pairs well with the same brand's dark OOH work as the light counterweight. Note the block chart only works when categories sum to a whole and count no more than four; beyond that the proportions get unreadable.
More like this
 7Analytics brand typography specimen
 7Analytics transit poster triptych
 7Analytics embossed business cards
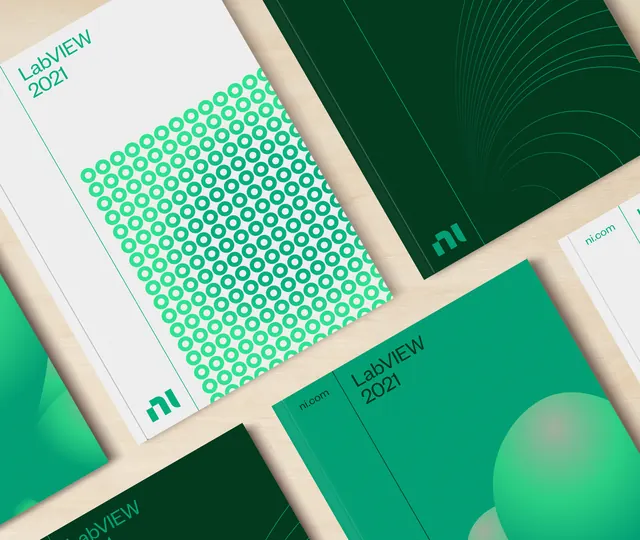 Mint geometric report cover system on wooden surface
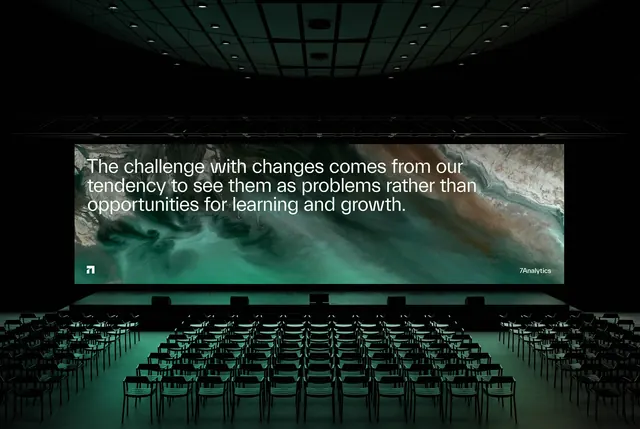 7Analytics auditorium screen slide
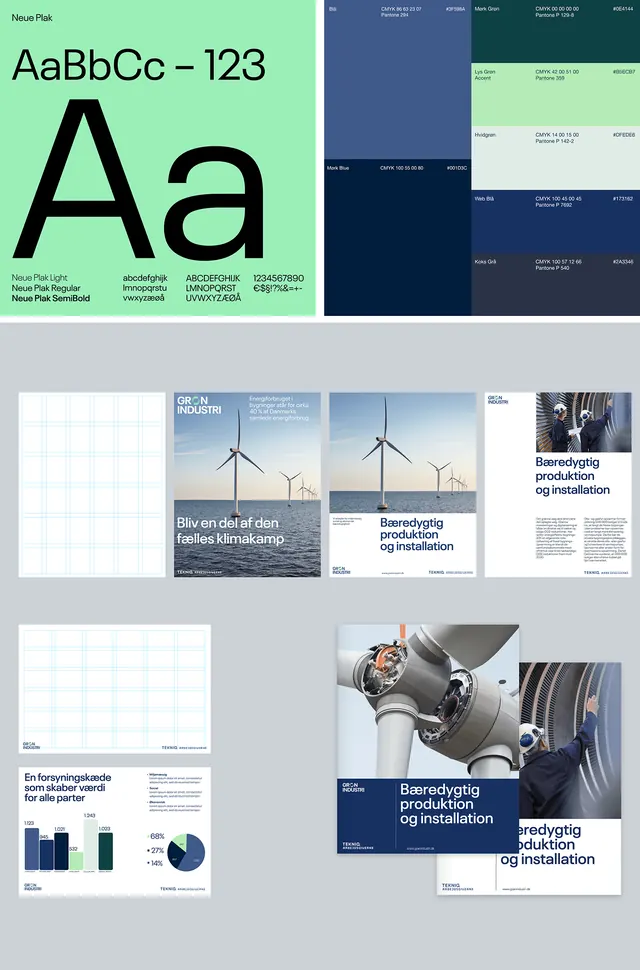 Industrial brand system with mint type and teal palette
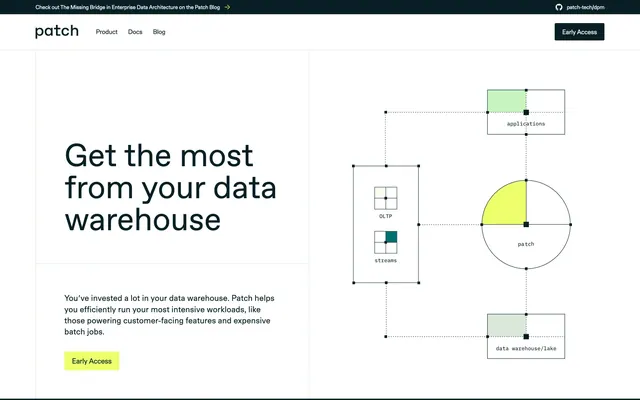 Patch data warehouse hero
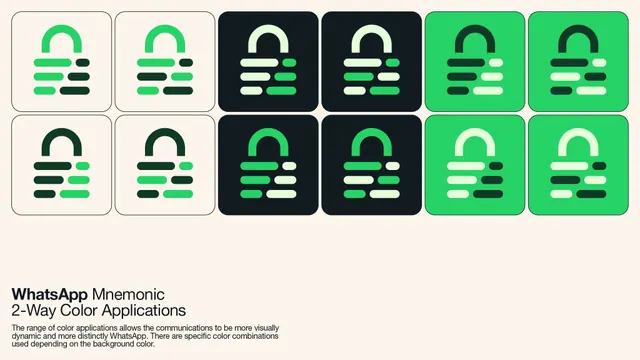 WhatsApp mnemonic two-way colour applications
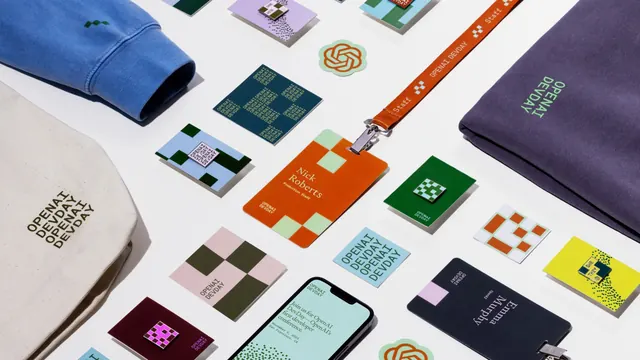 OpenAI DevDay conference collateral flat-lay
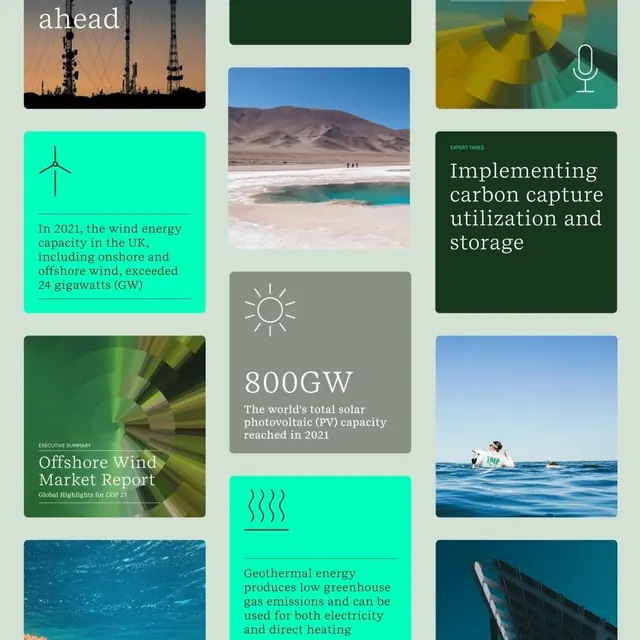 Infographic corporate-clean infographic
 Lime M monogram with teal badge
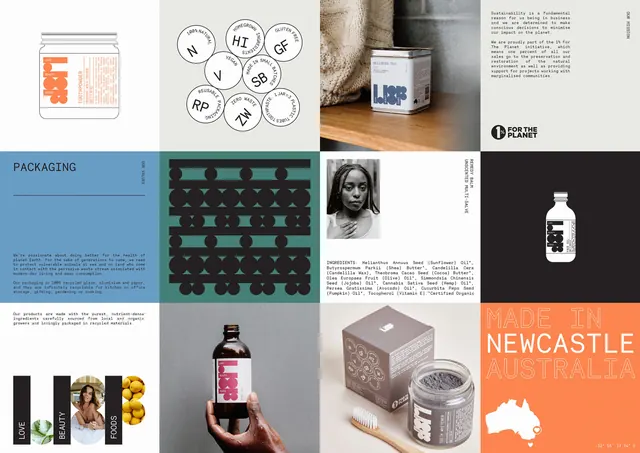 Love Beauty Foods identity system grid board
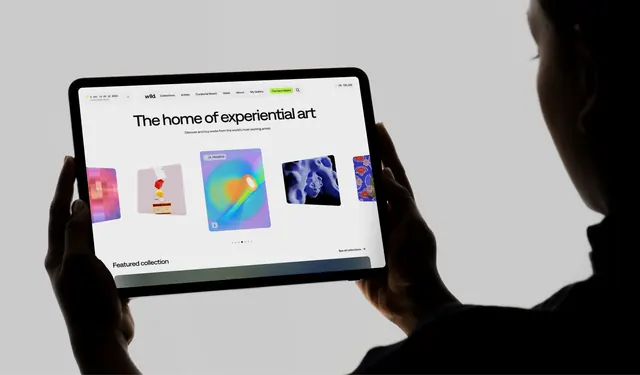 In-hand tablet mockup of the art platform homepage
 Trulioo mint business card on wood and dotted paper
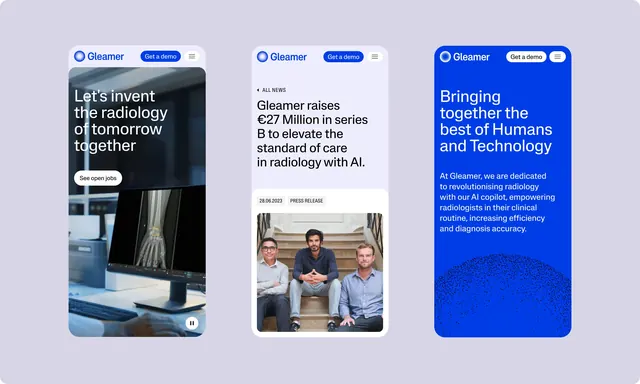 Gleamer three mobile screens on lavender
 Gleamer desktop homepage with video hero and icon trio
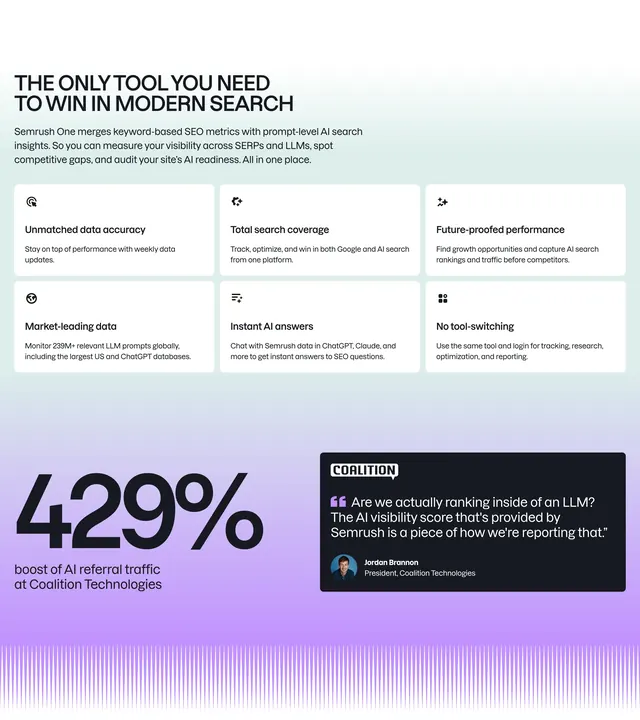 Semrush One value proposition grid
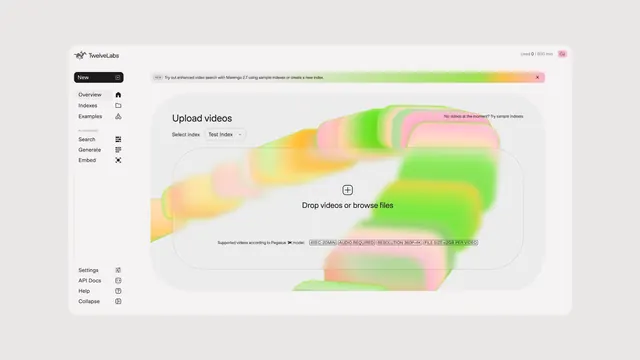 TwelveLabs video upload console
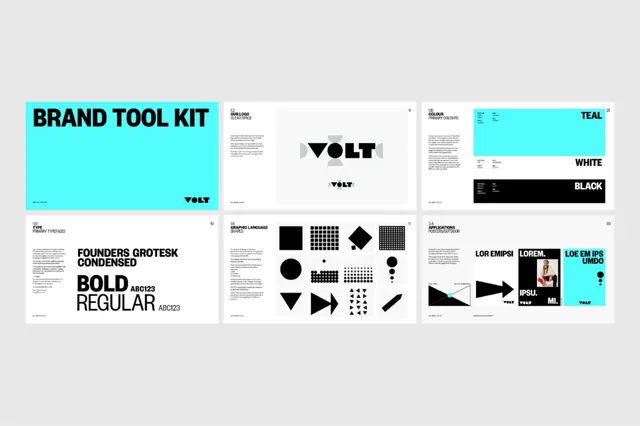 Minimal tech brand kit with cyan accent
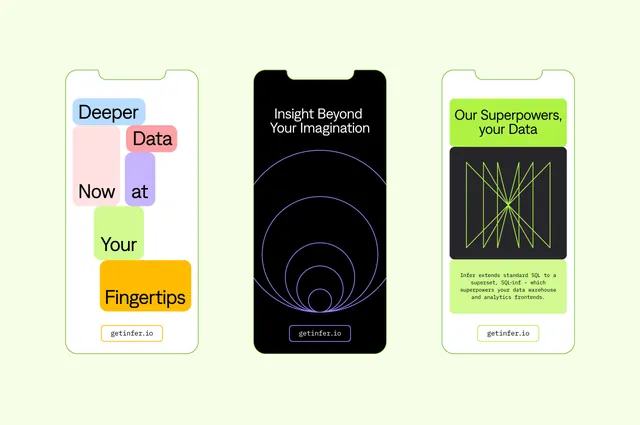 Infer mobile screens with color-block type and concentric line mark
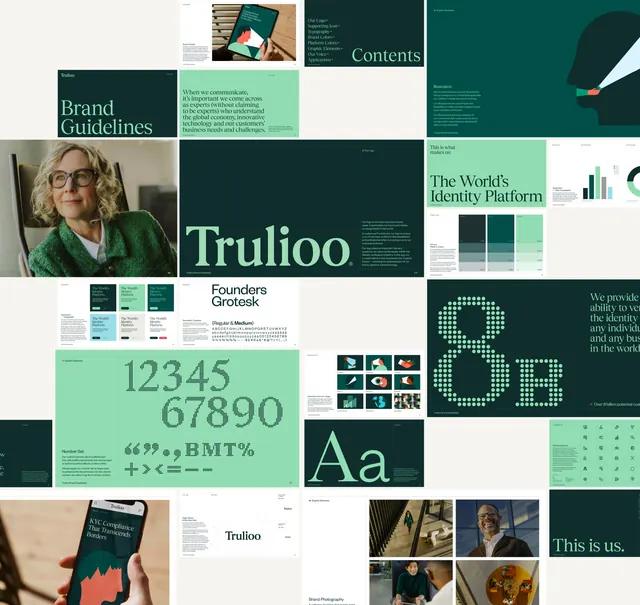 Trulioo brand guidelines contact sheet
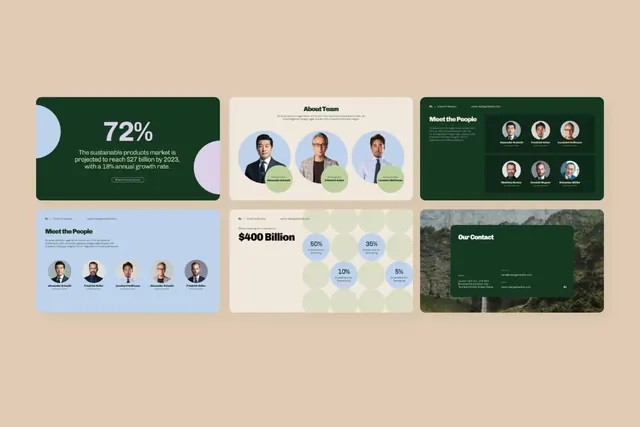 Presentation slide grid with data, team, and contact
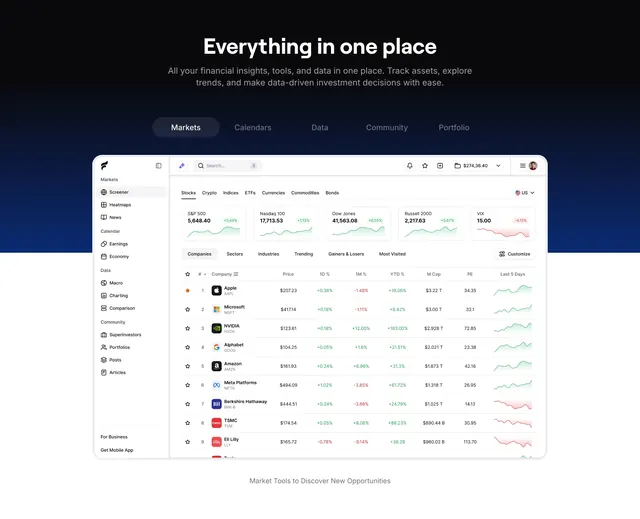 Finsepa tabbed features with full stock dashboard screenshot
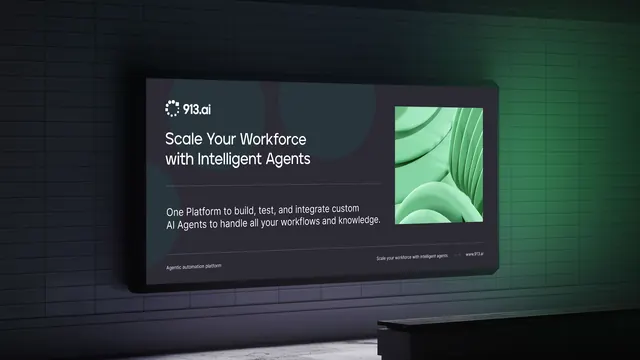 913.ai digital signage screen in a tiled station